All solutions

Brand Health Tracking Dashboard and Reporting Platform for Continuous Research

Bring your Brand Health Tracking (BHT) data into one place for analysis, dashboards and recurring reporting — from headline KPIs to the cuts and comparisons behind them.

Brand Health Tracking is an ongoing research programme used to monitor how effectiveness, perceptions and key brand measures change over time.

Book a call

Brand tracking means comparing change over time

Each new wave adds another layer to the tracker: more comparisons to check, more cuts to prepare and more questions from different teams.

Most trackers combine stable measures with brand-, category- or market-specific questions, while the reporting often ends up spread across spreadsheets, dashboards and PowerPoint decks.

New requests mean more manual edits, and after several rounds it can be hard to trace where a number came from or whether it still reflects the latest data.

DataTile works with the data your tracker already produces

DataTile works with the survey data your Brand Health Tracking programme already produces.

Your team can analyse the results, reuse the same reporting setup across waves, and build dashboards and recurring reports from the same underlying data — without repeatedly copying figures between files and rebuilding presentations for every new request.

The research design, questionnaire, sample and fieldwork stay with your existing research team, agency or provider. DataTile works with the resulting data.
DataTile Logo

See Brand Health Tracking

These two examples show quite different tracker setups: one built for broad, multi-market comparison, and one with a tighter set of measures and more depth around brand image.

Global, multi-market Brand Health Tracking

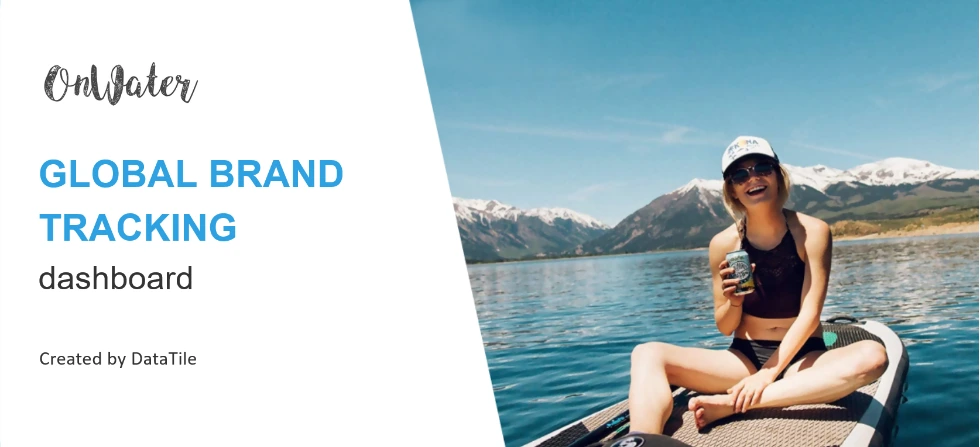
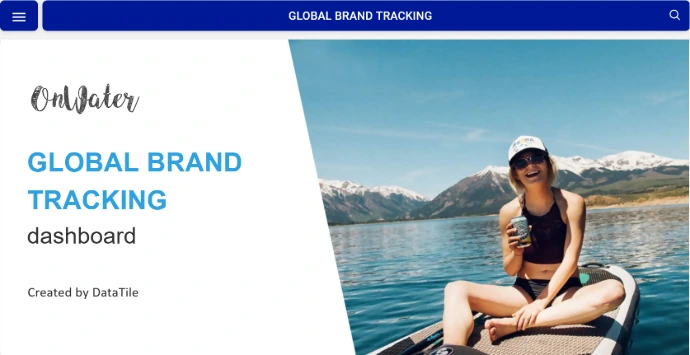
Example: Global Brand Health Tracking Dashboard


It is built for a wider tracking programme with multiple ways to compare the results.

It brings together awareness, consideration, brand attributes, NPS, audience segmentation and trends, with cuts across markets and demographic groups.


>> See Global Brand Health Tracking Dashboard


Global, multi-market Brand Health Tracking - DataTile

Focused tracking with deeper brand analysis

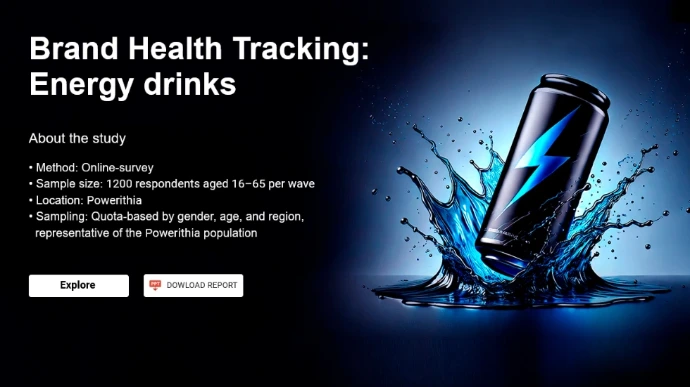
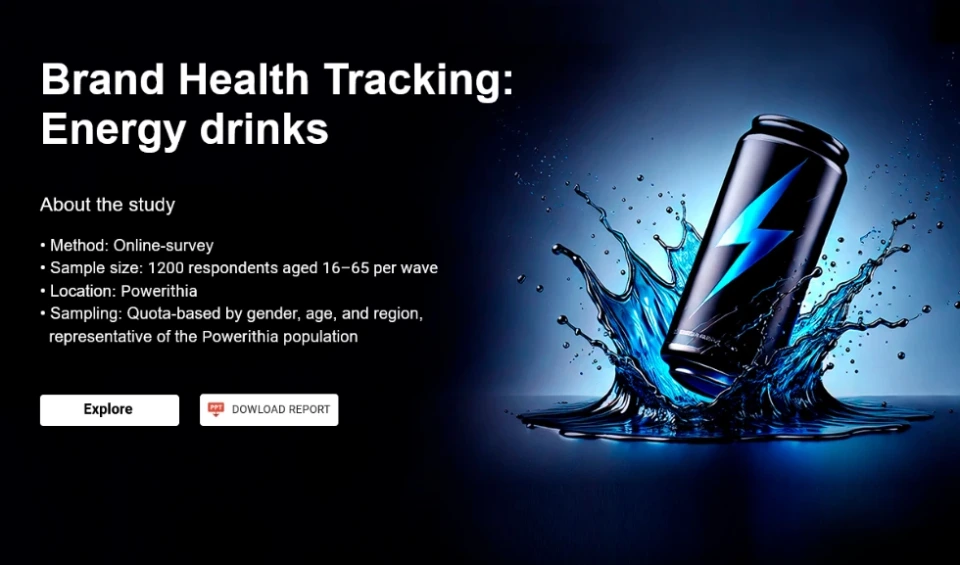
Example: Energy Drink BHT

The Energy Drink BHT Dashboard uses a more focused set of core measures and goes further into brand image.

As well as awareness and consideration, it lets users compare image attributes and look more closely at how different brands are associated with them.


>> Explore the Brand Health Tracking Dashboard


Focused tracking with deeper brand health tracking analysis - DataTile

Go beyond the headline Brand Health numbers


A Brand Health dashboard may give stakeholders the headline picture, but research teams often need to go deeper: what changed, where the differences occur and which audiences are driving them.

See what has actually changed


Compare waves and trends over time rather than looking at each reporting period in isolation.

Where the analysis calls for it, significance testing can help researchers check whether differences between periods or groups are statistically meaningful.


>> Knowledge Base — Significance in Crosstab

Compare brands, competitors and markets


If those dimensions are part of the study, the same dataset can be used to compare performance across brands, competitors, countries or other market groups.

You can move from a high-level trend view into more detailed cuts of the same survey data without setting up a separate analysis workflow each time.

Look at the audiences behind the result


Break results down by the demographic, behavioural or target groups already included in the research.

Researchers can use filters and crosstabs to answer questions such as whether a shift is happening across the whole audience or is concentrated in a particular group.


>> Knowledge Base — Setting up and applying weights in DataTile


Move from KPI views into the underlying data


Stakeholders may only need a concise set of Brand Health measures. Researchers usually need the cuts, comparisons and statistical detail behind them. DataTile lets both use the same reporting environment, while keeping the deeper analytical tools available to the research team. 


DataTile Brand Health Tracking Dashbord
Explore the live BHT dashboard – click the image.

Try DataTile for free

Isn’t it time you transformed your business? Try DataTile for free and see how it can enhance your productivity with it’s thorough analysis, interactivity and speed.

How a Brand Health tracker

works in DataTile


Test across multiple campaigns and waves


Step 1

Bring in your tracker data

Start with the survey data you already receive from your internal research team, agency or fieldwork provider.


Step 2

Set up the structure for analysis

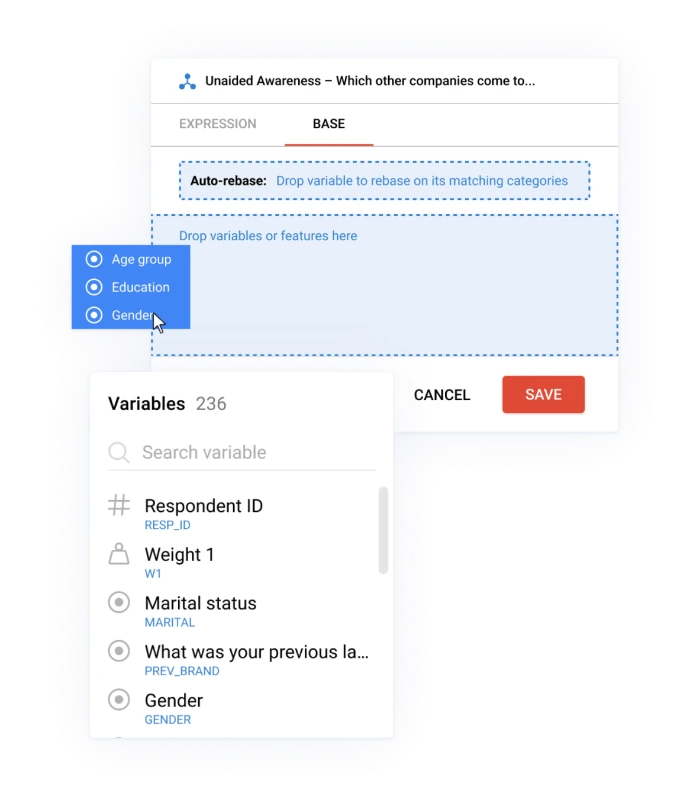
Align the variables, categories, weights and other elements your team needs for the tracker.


Step 4

Add the next wave

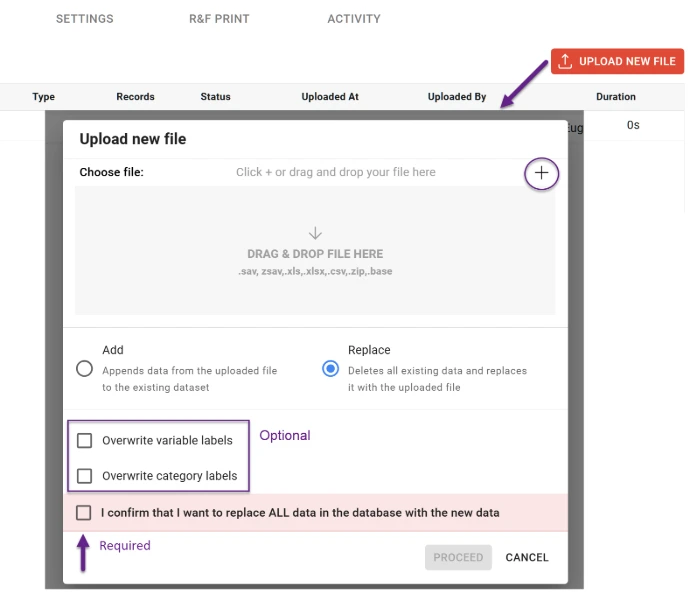
When new data arrives, match it against the existing tracker structure and review any differences before merging it into the database.


Step 3

Build the analysis and reporting setup

Create the comparisons, dashboard views and recurring outputs that match the way your team reports Brand Health.


Step 5

Update and share the results

Keep working with the established dashboard and reporting setup using the latest compatible data, then share the relevant views with colleagues or clients.


When the next wave arrives, 

you do not start from zero


For a recurring tracker, the first dashboard is only part of the job. 

What matters is what happens three months, six months or several waves later.

Add compatible waves to the existing tracker -  DataTile Dashboards

Add compatible waves to the existing tracker


When a new wave follows the existing structure, DataTile can match and merge it with the current database so the established dashboards and reports continue to work with the latest data.

If variables, categories or codes have changed, those differences can be reviewed before the merge is approved.

>> Knowledge Base — Uploading multiple waves for tracking studies

Keep PowerPoint in the process if people still want it


Interactive dashboards do not mean everyone has to stop using PowerPoint.

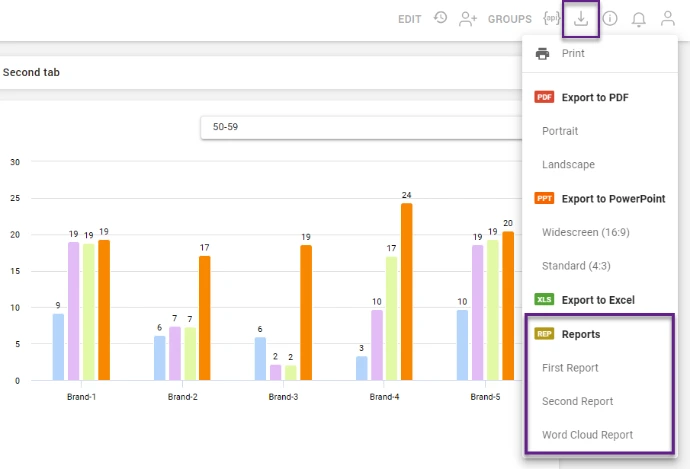
DataTile's Report Generator can link dashboard elements to a PowerPoint template and produce a new report using the current dashboard data.

That is useful when the Insight team wants an interactive environment but senior stakeholders or clients still expect a familiar presentation format.

>> Knowledge Base — Report Generator

Keep PowerPoint in the process if people still want it - DataTile Dashboards
Let people explore the results without giving them the keys to everything - DataTile Dashboards

Let people explore the results without giving them the keys to everything


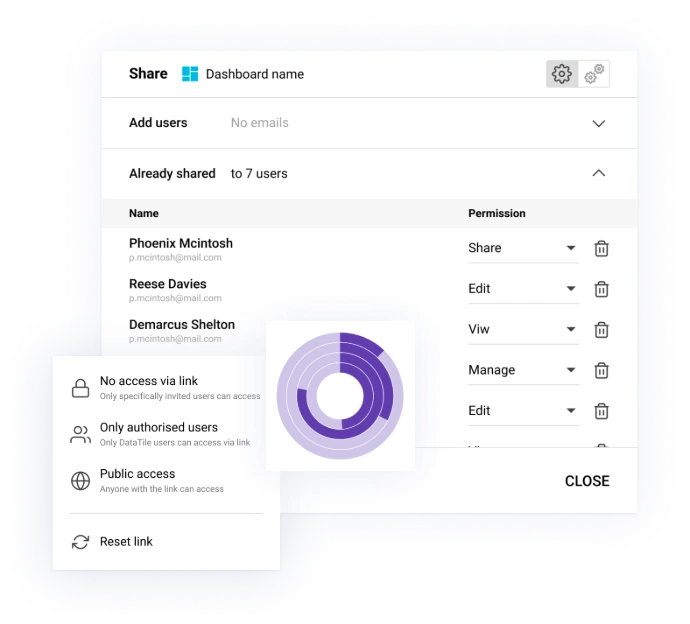
Dashboards can be shared with invited users, with different access levels controlling what they can view or change.

A Brand or Marketing stakeholder can get access to the reporting they need without having to work inside the research setup itself.

>> Knowledge Base — Sharing dashboards and access

Apply the research setup you already use


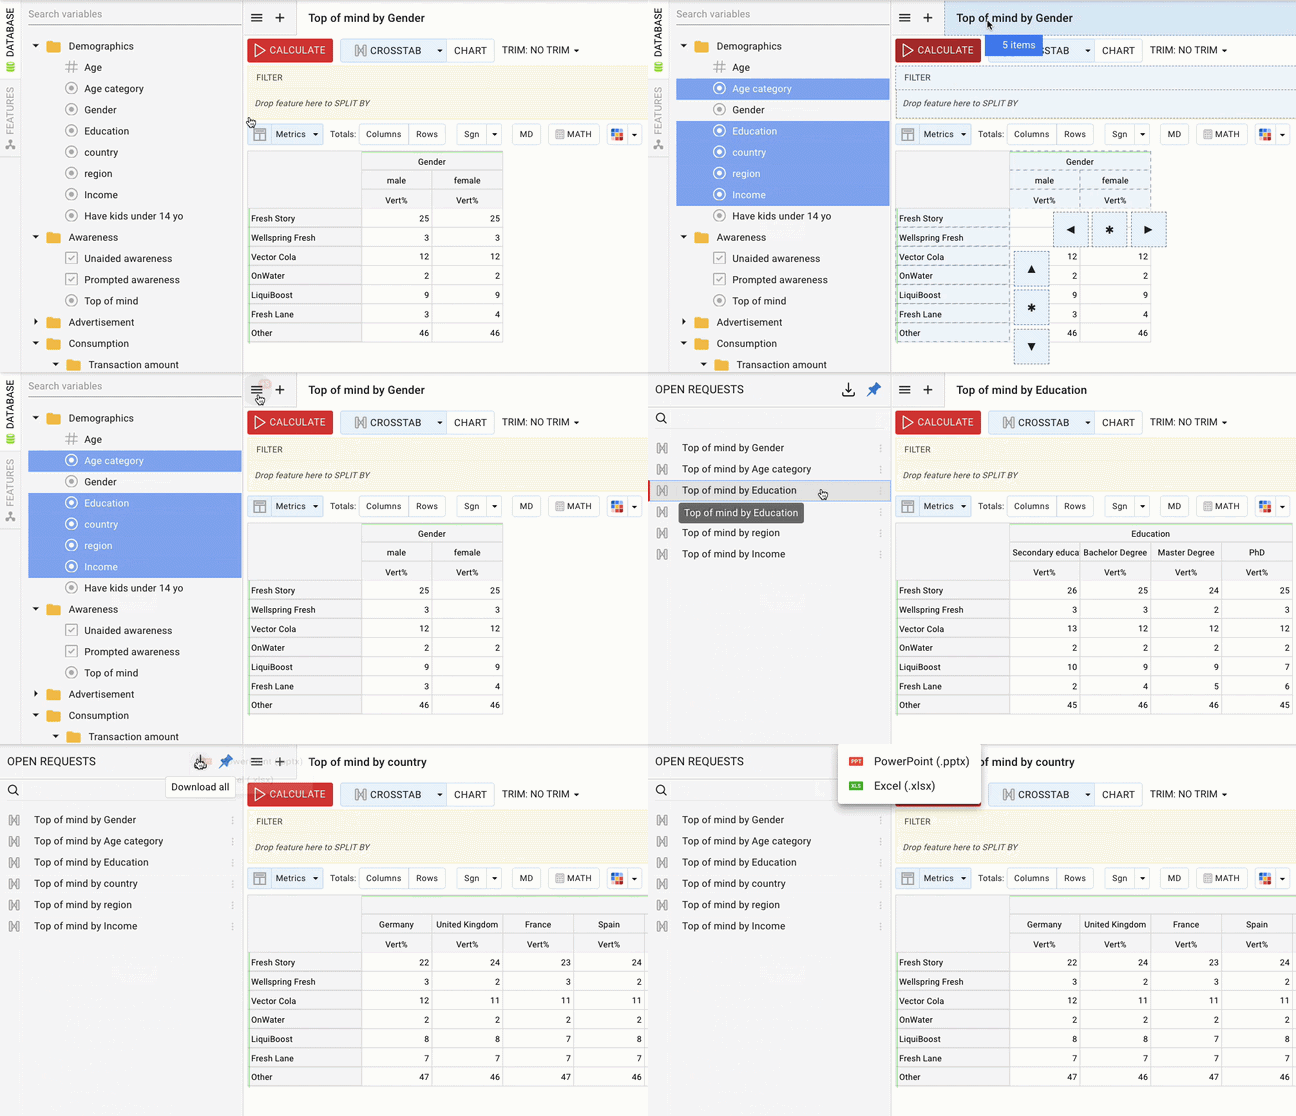
If the dataset includes weighting variables, they can be applied in DataTile. 

Researchers can also use crosstabs and significance testing as part of the same analysis workflow.

>> Knowledge Base — Weighting


Apply the research setup you already use - DataTile Crosstabs and Dashboards

BHT dashboard includes a range of key brand metrics - DataTile Dashboards

BHT dashboard includes a range of key brand metrics, including but not limited to:


  • Brand Awareness. The level of brand recognition among the target audience.
  • Brand Perception. How consumers perceive the brand in terms of attributes, quality, and trustworthiness.
  • Brand Loyalty. The degree of customer loyalty and advocacy towards the brand.
  • Purchase Intent. The likelihood of consumers choosing the brand over competitors.
  • Brand Equity. The overall value of the brand in the minds of consumers and its impact on business performance.
  • Shopper Profile. Split on gender, income etc.

Global Brand Tracking Dashboard 


In some industries the Brand Health measurement is closely linked to Advertising visibility evaluation. This dashboard shows how brand's advertising activities perform, what are the most effective channels of communication. Also you can visualize the Ad emotional perception

DataTile Brand Health Tracking Dashbord
Explore the live dashboard – click the image.

Talk to our team

DataTile professionals will answer all your questions and help you choose the best option for your business.

Trusted by

companies across the world and industries

See our case studies

Global Media & Entertainment  Logo
JICMAIL Discovery
Fastuna Logo - Streamlining the Analysis of Hundreds of Ad Tests
Wargaming logo

Built for the people who actually work with brand trackers

Head of Insights / Insight Director


Needs a reliable view of how the brand is moving over time and across markets, with enough depth to answer the questions that come after the topline.


Brand or Consumer Insights Manager


Works with the tracker day to day — checking trends, comparing audiences and turning the findings into something Brand and Marketing teams can use.

Research / Analytics Lead


Looks after the detail behind the dashboard: data structure, weighting, crosstabs, significance testing and consistency between waves. 


Brand & Marketing stakeholders


Usually do not need the full research setup. They need clear access to the measures, trends and audience views that help them make decisions.


 “DataTile helps us turn around research faster, lets stakeholders explore the data on their own, and gives our researchers back the time they used to spend on manual tasks.”

—Katsia Yakushyk, Researcher, Wargaming

​>> Read the full Wargaming case study here

Explore DataTile for your team

For Brand & Insight Teams


See how DataTile helps internal Insight teams work with recurring survey and tracker data and make the results easier to use across the organisation.


See how we can help

For Research Agencies


See how research teams use DataTile for survey analysis, client dashboards and repeatable reporting across ongoing research programmes.


See how we can help

FAQs


No. DataTile works with the survey data produced by your existing tracker.

Your research design, questionnaire, sample and fieldwork can stay with your internal team, research agency or existing provider.
Yes, where those dimensions are included in your study.

You can compare tracker results over time and break them down by brands, markets, audience groups and other variables already present in the data.


 If the new wave is compatible with the existing structure, it can be matched and merged into the existing database so your dashboards and reports can continue to use the updated data.


Changes do not have to be hidden or ignored.
If variables, categories or codes no longer match the existing tracker structure, DataTile can surface those differences for review before the new wave is merged.


 Yes. You can filter and cross-tab results using the demographic, behavioural or other audience variables included in the research.

 Yes. DataTile supports weighting and statistical significance testing as part of survey analysis.
The exact setup depends on the structure of your data and the comparisons you want to make.
Yes. Dashboards can be shared with invited users, with access levels controlling what they can view or change.
That means stakeholders can explore the reporting without editing the underlying research setup


Yes. DataTile's Report Generator can use dashboard elements in a PowerPoint template, so recurring presentation reporting can sit alongside the interactive dashboard.

You get onboarding, documentation, and responsive support to help your team adopt the platform. For larger rollouts, we offer structured training to standardise survey reporting across teams and markets.

See how your Brand Health tracker could work in DataTile  

 
You do not need to redesign your research programme to find out.
Bring us an existing tracker, a recent wave and an example of how you report it today. 
We can talk through the setup, the analysis your team needs and 
what you want stakeholders to get from the results