

 All solutions
NPS & Customer Satisfaction Dashboard and Reporting
DataTile helps research and insight teams turn existing NPS and customer-satisfaction survey data into analysis, dashboards and reports in hours, not days, weeks or months.
Calculate NPS directly in DataTile, compare scores across customer groups and survey waves, check whether differences are statistically significant, and give stakeholders a clear view of the results.
Your survey and fieldwork can stay where they are.
DataTile comes in once the data is ready for analysis.
The NPS score is only the starting point
Then the real research starts: Which customers are behind the change? Is one market performing differently from another? Did the score genuinely move, or could the difference be explained by sample variation?
And how does NPS sit alongside the other satisfaction measures in the study?
Analyse the score and what sits behind it
Researchers can compare groups, apply weights, work in crosstabs and test differences for significance. The results can then be presented in dashboards or reports for people who do not need to work with the underlying analysis.
DataTile is the analysis and reporting part of the workflow — not the survey or fieldwork platform.

See a customer-satisfaction dashboard in DataTile
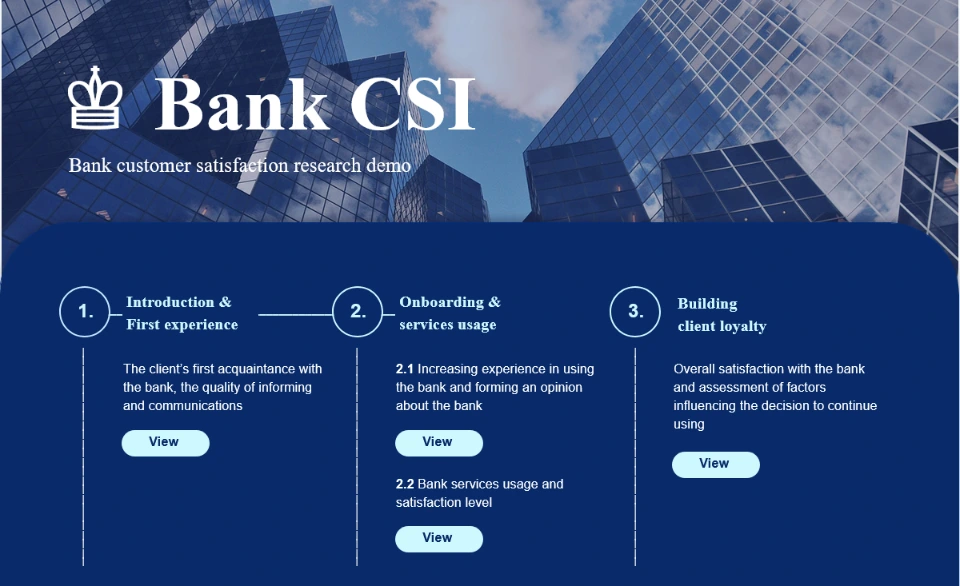
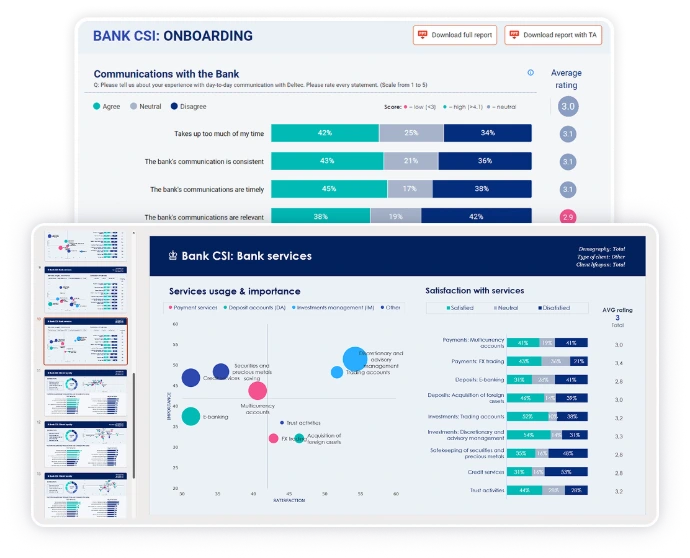
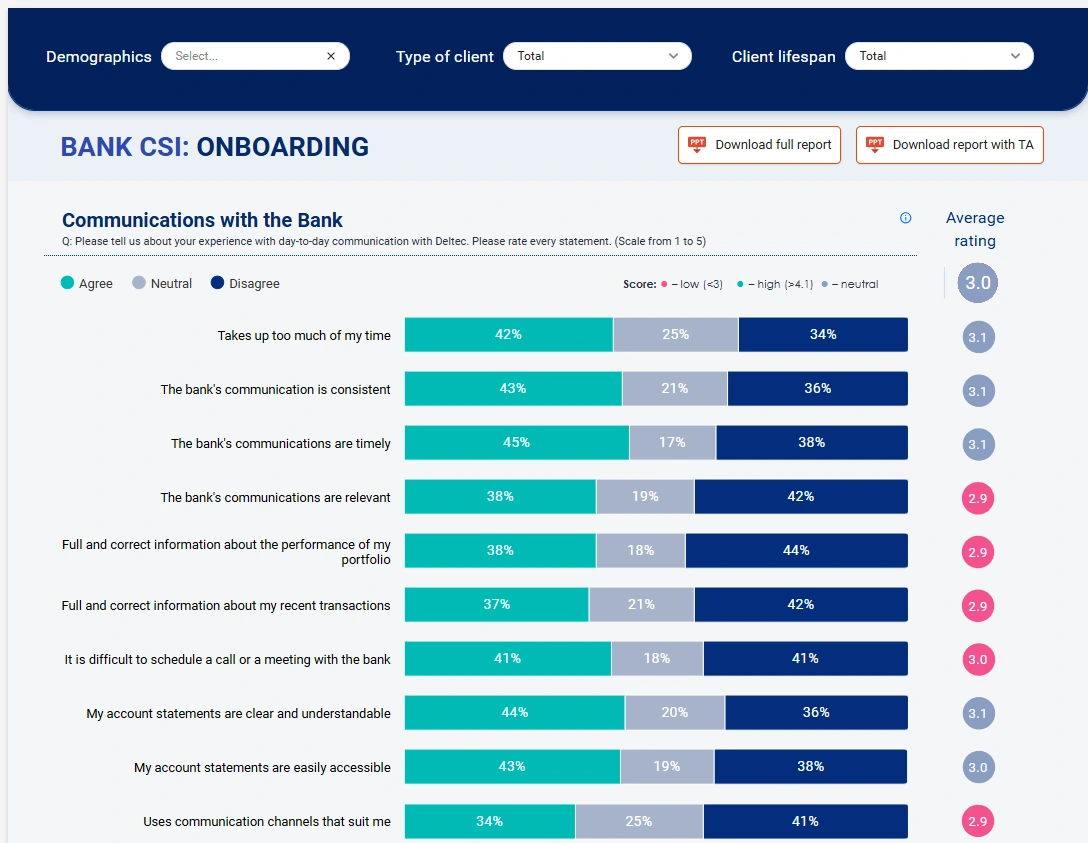
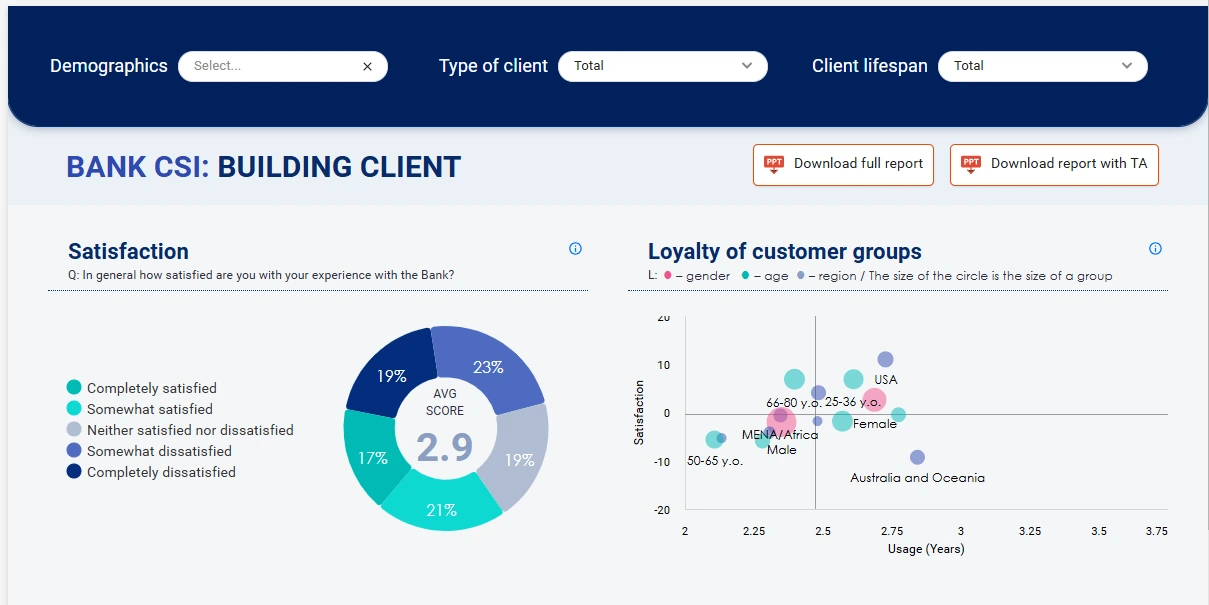
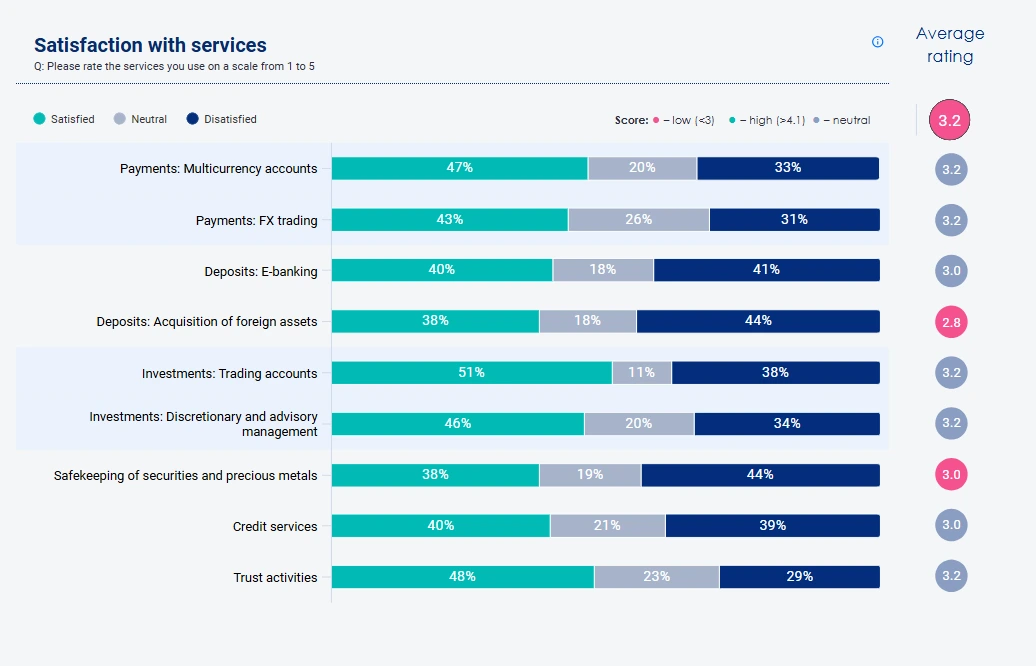
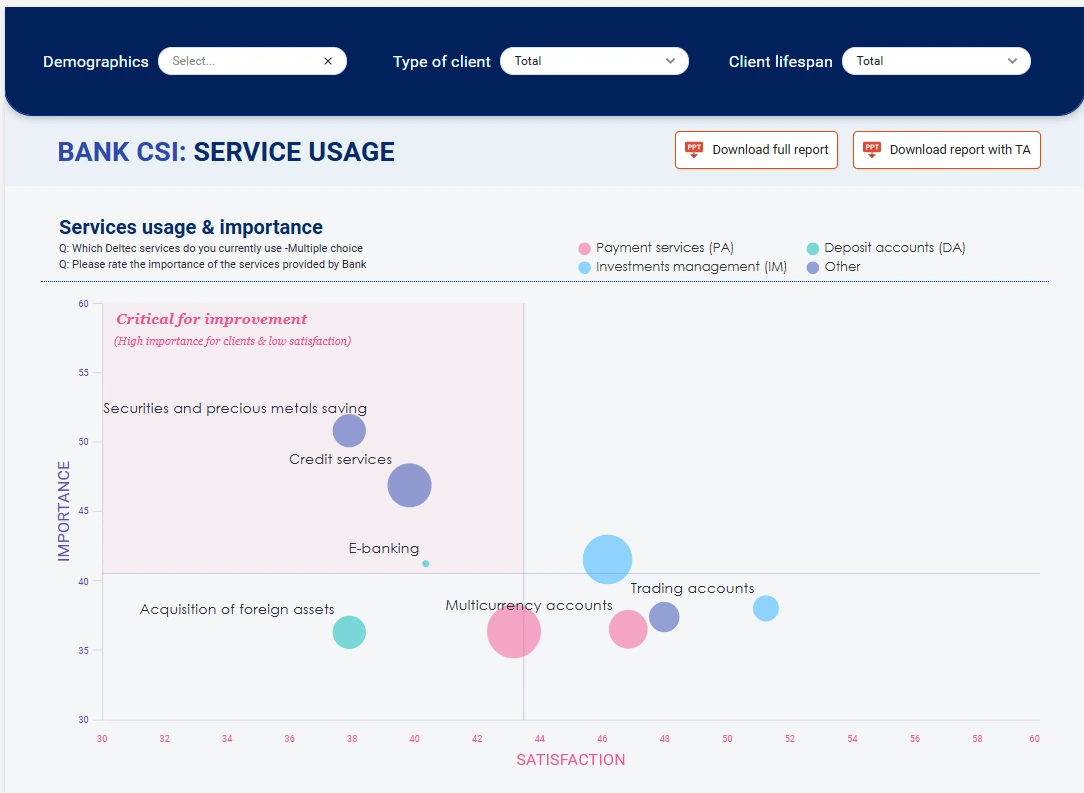
The Bank CSI dashboard shows one way an ongoing customer-satisfaction study can be presented in DataTile.
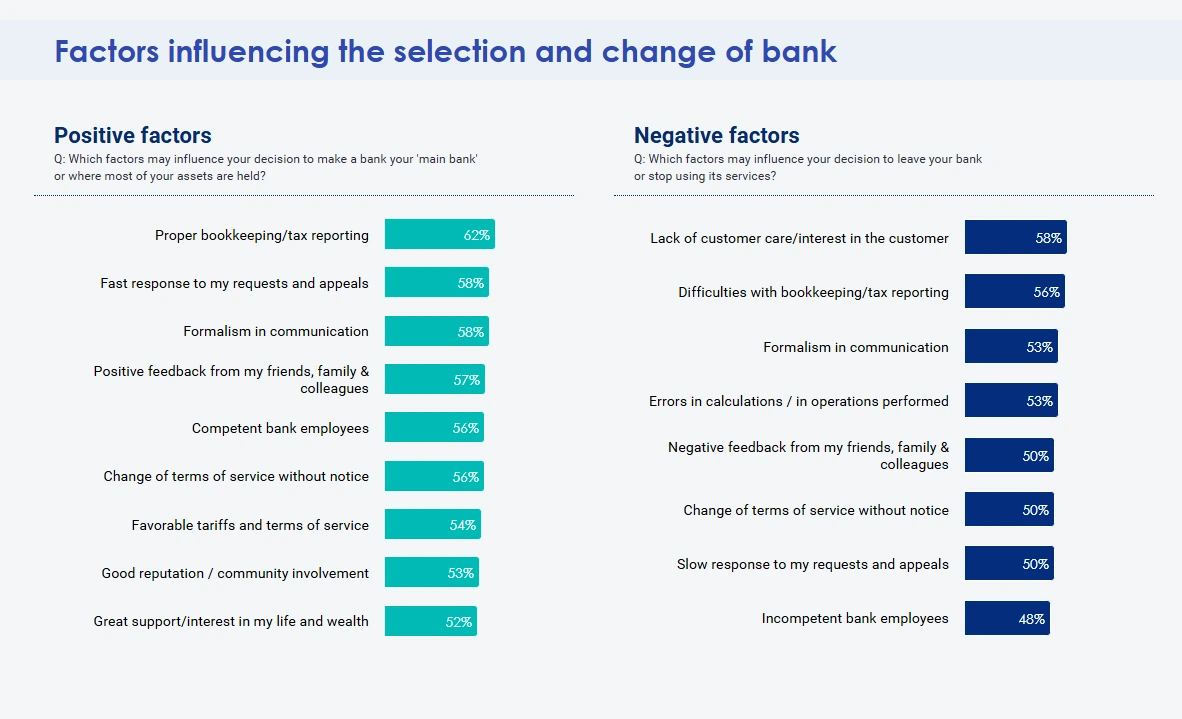
It brings the headline satisfaction measure together with customer groups, demographics, touchpoints and trends, so the result can be explored rather than reduced to a single number.
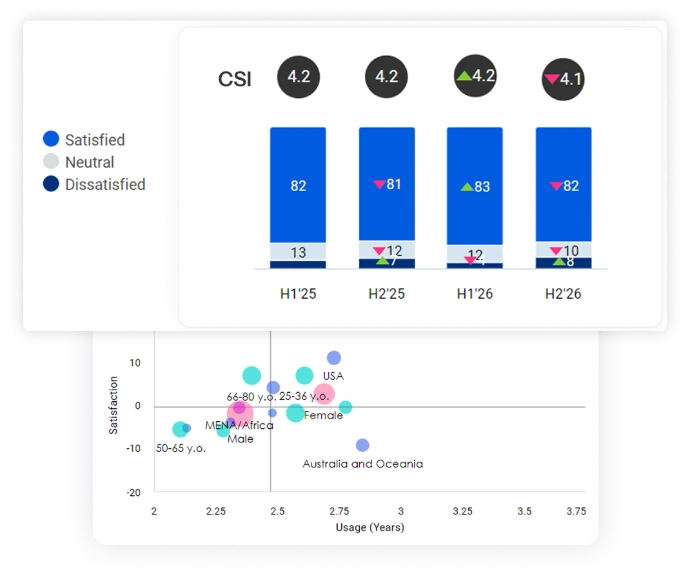
For example, instead of simply seeing that satisfaction has changed, a researcher can look at how the result differs between groups or touchpoints and how it has moved over time.
Find out what is behind the score
The useful questions are usually underneath it.
Compare the groups
Follow the change over time
Instead of looking at this quarter's score on its own, you can see how it compares with previous periods and where the movement is coming from.
Check whether a difference is meaningful
DataTile supports statistical significance testing, so researchers can check whether differences between groups or periods are meaningful before drawing conclusions from them.
NPS is calculated in DataTile, not just displayed
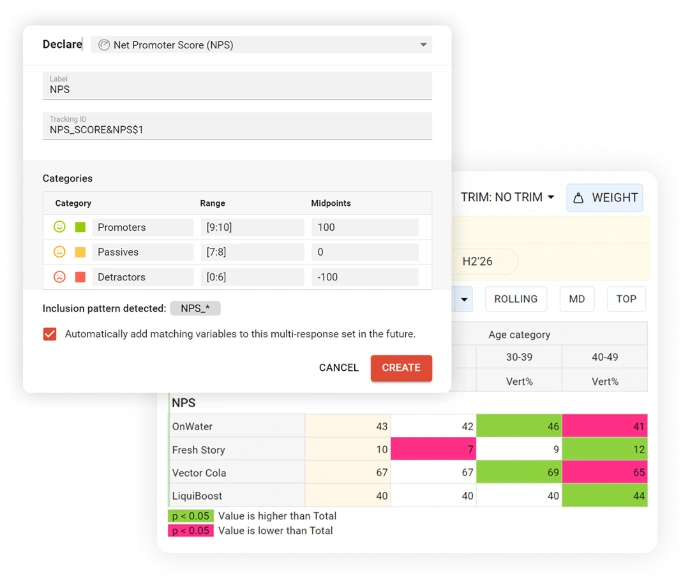
DataTile has a dedicated NPS variable with built-in calculation.
Define the recommendation question and the relevant NPS categories, and the score can be calculated directly in a crosstab.
From there, researchers can analyse NPS like the rest of the study:
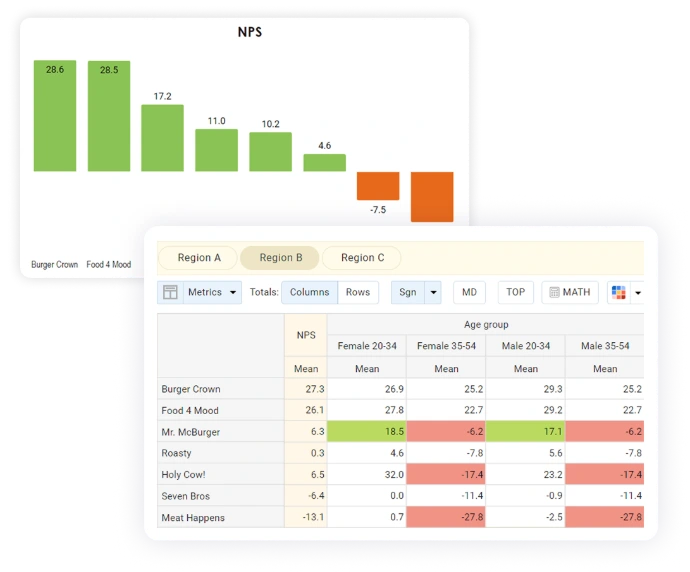
compare scores across groups;
apply weighting;
look at results across waves;
test differences between NPS values.
For NPS variables created with DataTile's built-in tool, the platform also supports NPS-specific statistical testing.
NPS rarely sits on its own
An NPS study often contains much more than the recommendation question.
You may also be measuring satisfaction with a service, product, branch, interaction or individual touchpoint. And those measures can help put the NPS result into context.
DataTile lets you analyse the customer-satisfaction measures already present in the dataset alongside NPS, using the same groups, filters and reporting views.
That means the dashboard does not have to be a page with one large NPS number. It can show the wider picture the research was designed to measure.
One study, different levels of detail
The person presenting NPS to senior management and the researcher checking the result do not need the same view.
A stakeholder may want:
the current NPS;
the change since the previous wave;
the weakest and strongest groups;
a small number of supporting satisfaction measures.
The research team may need to go much deeper:
crosstabs;
bases;
weighting;
filters;
group comparisons;
statistical significance.
DataTile lets both views come from the same underlying research data.

Try DataTile for free
Want to see how the analysis works before talking to us?
Open the DataTile sandbox and explore crosstabs, dashboards and reporting with sample data.
From survey data to an NPS dashboard
Test across multiple campaigns and waves
1. Bring in the survey data
Start with the dataset produced by your internal research team, agency or fieldwork provider.
2. Set up the measures you need
3. Analyse the result
4. Check the differences
Use crosstabs and statistical testing when you need to understand whether apparent differences are meaningful.
5. Build the reporting view
6. Share the result
Give people access to the views they need without requiring every stakeholder to work through the underlying research tables.
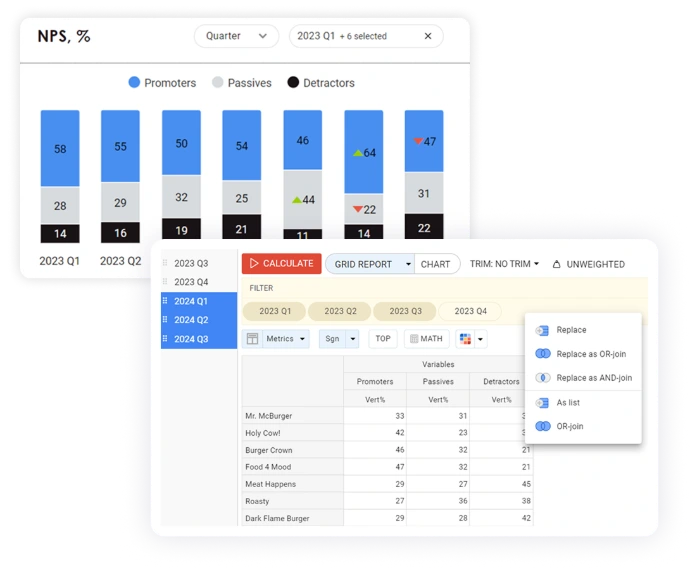
That should not mean rebuilding the whole analysis every time another dataset arrives.
New tracking data can be added to an existing study, so researchers can continue comparing periods within the same project where the study structure remains compatible.
For recurring NPS studies, the NPS setup can also be configured to include future variables that follow the same defined pattern.
The result is a workflow that can continue from one wave to the next rather than a collection of disconnected reports.
And if your team still reports in PowerPoint
That's fine too.
DataTile's Report Generator supports PowerPoint-based reporting, so a dashboard does not have to replace an established slide workflow.
Use interactive dashboards where they make sense and PowerPoint where stakeholders still need a deck.
What belongs in an NPS dashboard?
The dashboard should reflect the questions in the research.
Depending on the study, that might include:
NPS
Customer-satisfaction measures
Trends
Segments and customer groups
Markets, branches, products or touchpoints
Markets, branches, products or touchpoints
The aim is not to squeeze every possible metric onto one screen.
It is to give each audience the level of detail they actually need.

Talk to our team
DataTile professionals will answer all your questions and help you choose the best option for your business.








Who uses it?
Customer Insights / CX Lead
Research or Analytics Lead
Needs access to the evidence behind the headline: crosstabs, weights, bases, comparisons and significance testing.
Insight / Research Manager
Runs the study day to day and needs to move between analysis, dashboards and recurring reporting without creating separate versions of the truth.
Business stakeholders
Usually need the answer, not the analytical setup: the latest score, the trend and the results relevant to their area.

“Our strategic client was able to achieve greater flexibility and has significantly improved the speed of obtaining operational data. Moreover, it streamlined access to research data for final users and as a result accelerated their business-decision making process.”

Explore DataTile for your team
For Brand & Insight Teams
See how DataTile helps internal insight teams analyse recurring survey data and make the results easier to use across the business.
For Research Agencies
FAQs
Yes. The calculated NPS score can be used directly in crosstab analysis.
Yes. Dashboard access can be managed separately from editing access.
Already have an NPS tracker?
Show us the study you run today.
and show you where DataTile could fit.