


Product Feature Testing Dashboard
Which features should go into the next version of a product or service? This interactive DataTile dashboard shows how researchers can compare feature ratings, see how responses vary by audience and assess the reach of different feature combinations.
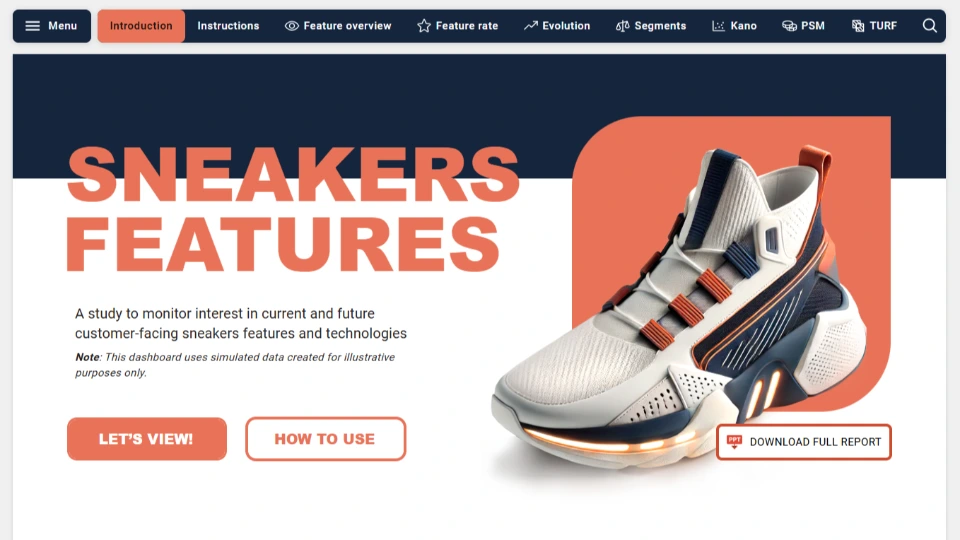
What product feature testing helps teams decide
Which ideas do people like, and which solve a problem they have?
Which features do customers expect, and which could make the product more appealing?
Which combination reaches the most people?
What prices do people find acceptable for each feature?
✽ Product Feature Testing - Sneakers Example
What this dashboard shows
The DataTile dashboard brings together feature ratings, Kano analysis, TURF and price sensitivity results. Researchers can also compare audiences and track changes over time.
Compare feature ratings
Open a feature profile to see the idea as it was presented to respondents and review its scores.
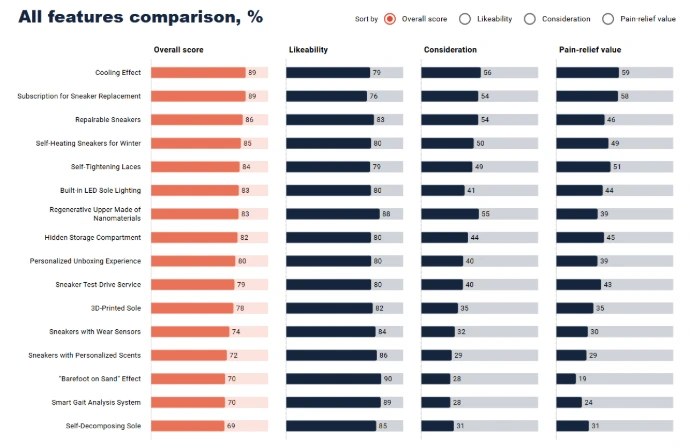
In the comparison view, rank all the ideas by overall score, likeability, consideration or pain-relief value.
See what customers expect with Kano
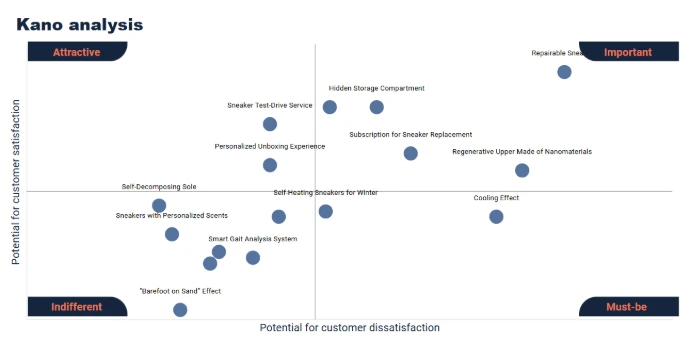
The Kano view shows how much satisfaction a feature could add if included and how much dissatisfaction its absence could cause.
This helps researchers distinguish features customers expect from those that could give them an extra reason to choose the product..
Assess feature combinations with TURF
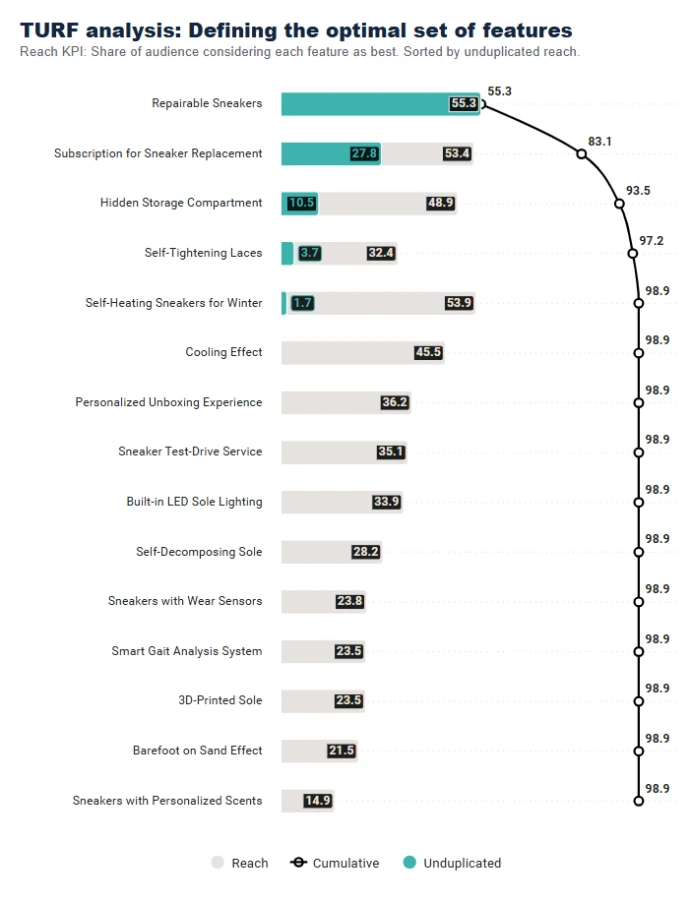
Use DataTile’s TURF analysis to see how many people a set of features reaches, counting each person once. That’s its unduplicated reach.
A feature with strong individual appeal may contribute little extra reach if the same people already favour other features in the set.
Examine price acceptance with PSM
Compare responses across audiences
Filter feature results by age, gender or income. The Segments view compares generational profiles, and the TURF view has its own demographic filters for exploring the reach of feature combinations.
Follow changes over time
The Evolution view tracks how feature ratings and perceptions change over time. In this demo, the trend charts cover 2021 to 2024.
Why use an interactive dashboard?
Product teams often return to the same study when a feature comes back into discussion. In DataTile, researchers can give colleagues a way to find that feature, check how different audiences rated it and revisit earlier results.
This is especially helpful when a study covers many ideas or runs in several waves.
Book a demo
A closer look at the dashboard
Compare ideas side by side with Feature rate
See where features sit in the Kano analysis
On the Kano screen, find a feature on the chart and check which labelled area it falls into. Compare its position with other ideas to see which ones customers may expect and which could add to their satisfaction.
Explore price acceptance for a feature with PSM
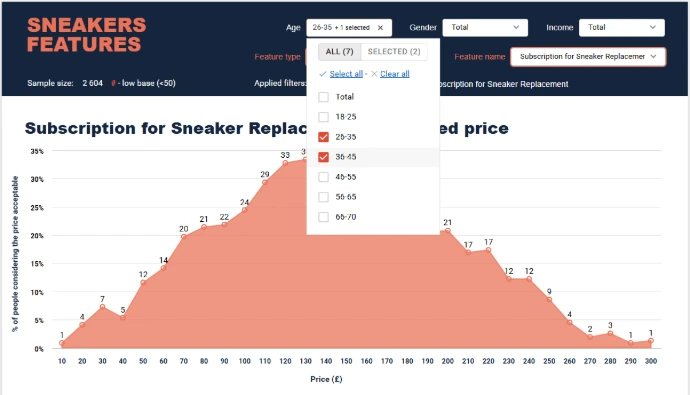
On the PSM screen, pick a feature from the selector and follow its price acceptance curve. Switch to another feature to see how its curve differs.
See what each feature adds with TURF
Working with TURF regularly?
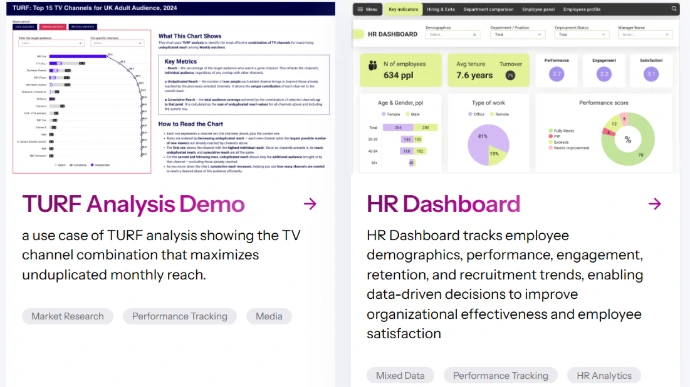
Our TURF analysis dashboard for PR and media planning demonstrates another application: comparing news channels using Ofcom data.
See how the same reach method can answer a different research question
The media planning example uses Ofcom survey data to compare news channels and examine how much each channel adds to the audience reached.
Explore the TURF dashboard for media planning

Browse more examples in the Dashboard Gallery
See other ways research data can be analysed, visualised and shared in DataTile

Discuss your feature testing study with our experts
Have feature testing results to analyse or share? Talk to us about building a DataTile dashboard around the measures you use, the audiences you compare and the questions your team or client needs to answer.