

Crosstab Software for Survey Data Analysis
Build crosstabs, compare audiences and segments, apply weights and significance tests, and move the results into dashboards and reports — all within the same research workflow.
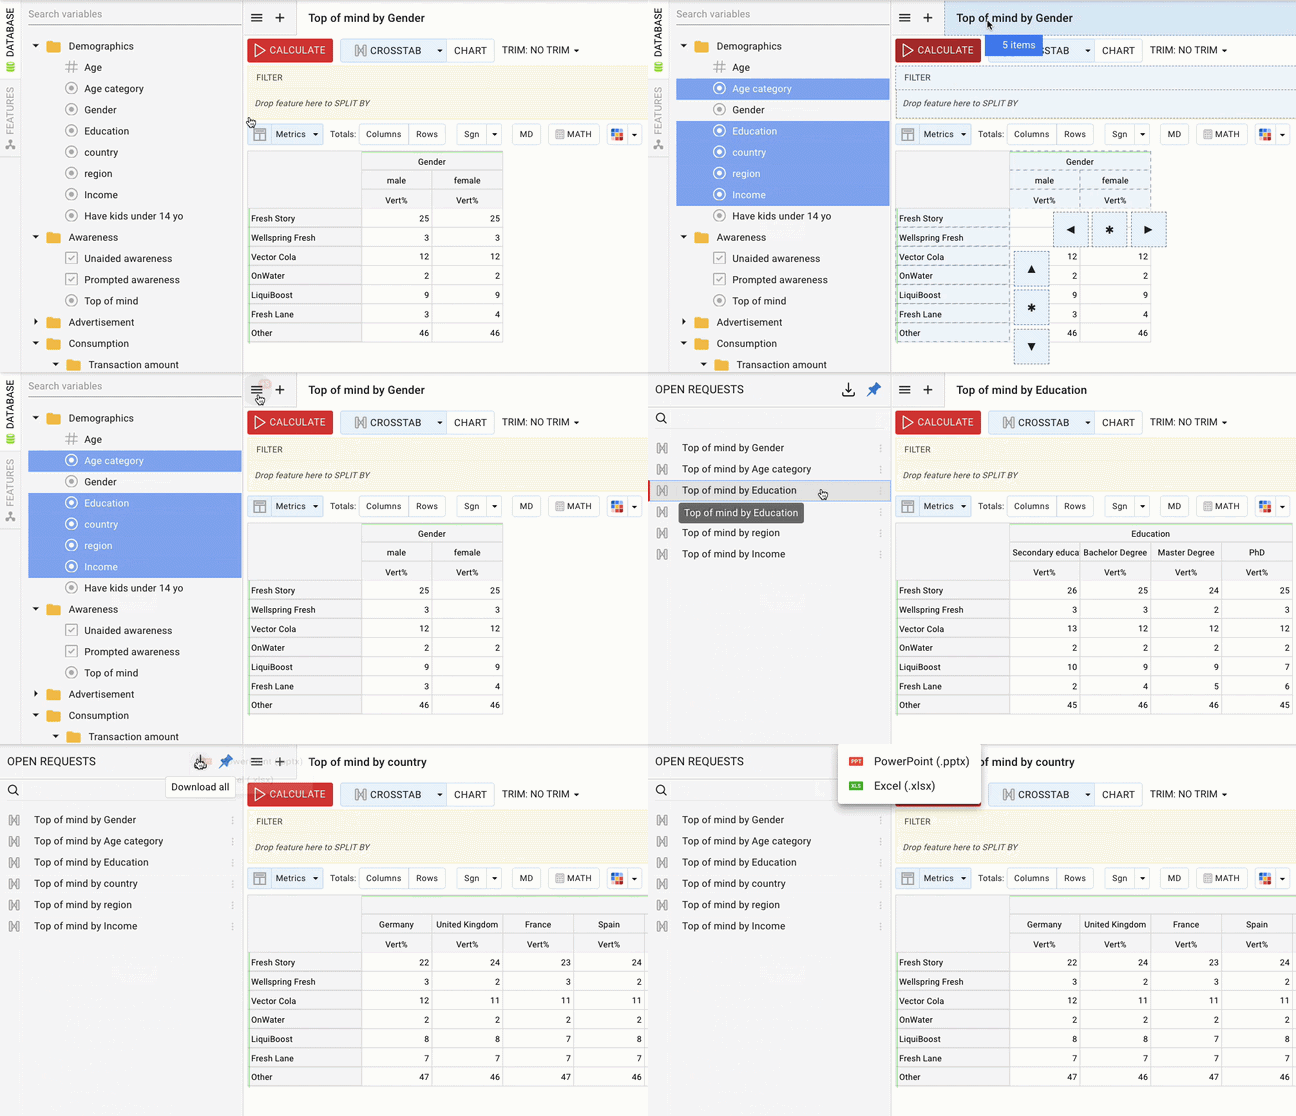
Crosstabs are where the questions get specific
Explore segments. Test differences. Keep moving.
>> See more in our Knowledge Base

Built for survey data, not just rows and columns
Crosstab is the default analysis mode in DataTile, so researchers can work with survey variables and research-specific structures directly, rather than moving the analysis into a separate general-purpose reporting tool.
✽ DataTile
Build crosstabs around the way your study is structured
Flexible rows and columns
Build cross-tabulations from variables or individual categories and change the view as the research question changes.
Filters and splits
Focus the analysis on a particular audience or add another dimension such as market, region or wave without rebuilding the main table.
Saved analysis
Keep several analysis views open in Tabs and organise useful tables and charts into Decks so you can return to them later instead of starting again.
Metrics and calculations

See crosstabs in DataTile
Build survey cuts, compare audiences, apply weights and significance testing, and see how the analysis fits into the wider reporting workflow.
Need 30 similar tables? Don’t build them 30 times
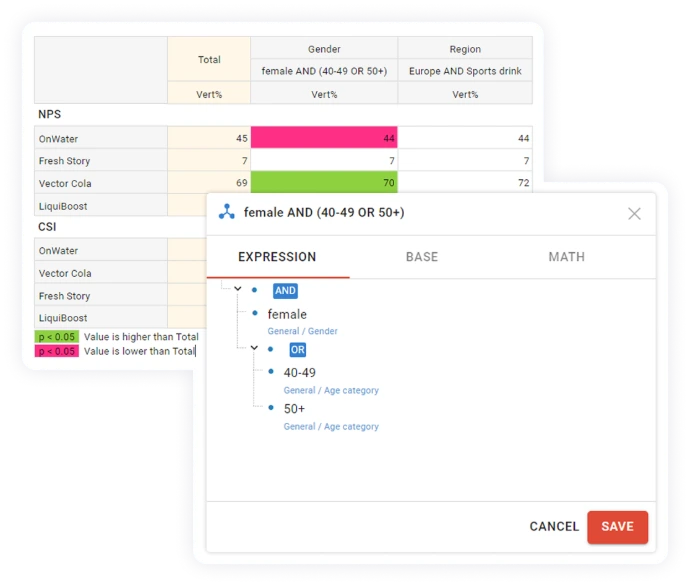
Example cuts
Women AND Age 40+
Market A AND Brand users
Q1 2026 vs Q1 2025
Define the audiences that matter to your research
>> Learn more: Creating a logical variable
Work with more complex survey structures
DataTile supports multi-response questions as well as repeated structures such as brands, statements, markets or waves. Multi-response sets can represent several related variables as one research construct instead of treating every answer as an unrelated field.
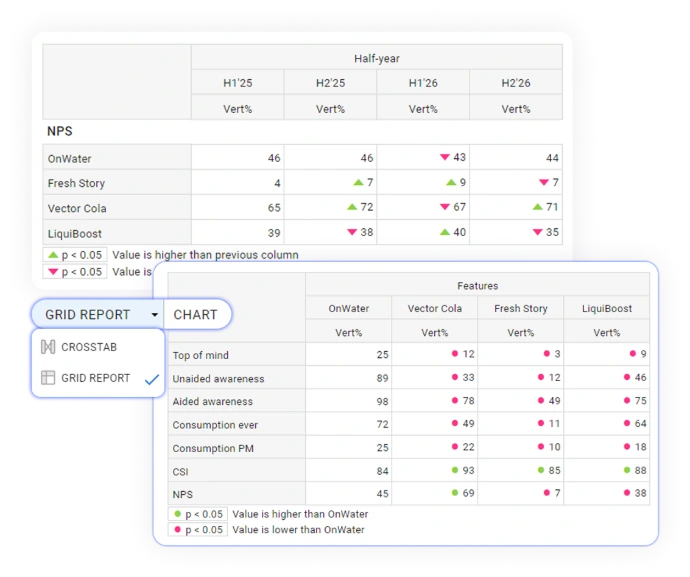
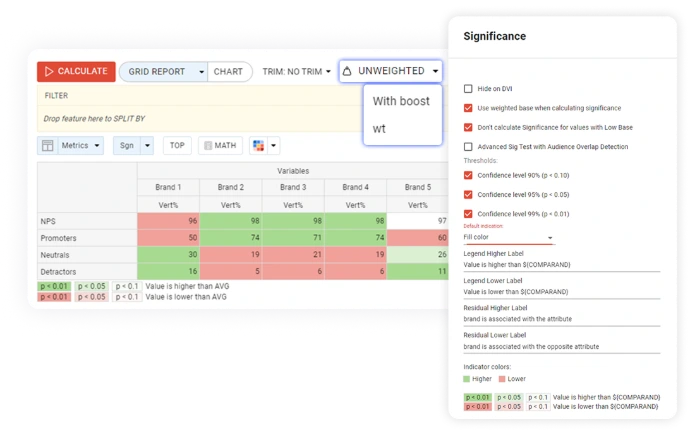
For families of related variables, Grid Report provides another way to analyse the data. It aligns matching categories across variables so researchers can compare brands, markets, waves, measures or repeated question blocks side by side.
Analyse more than percentages
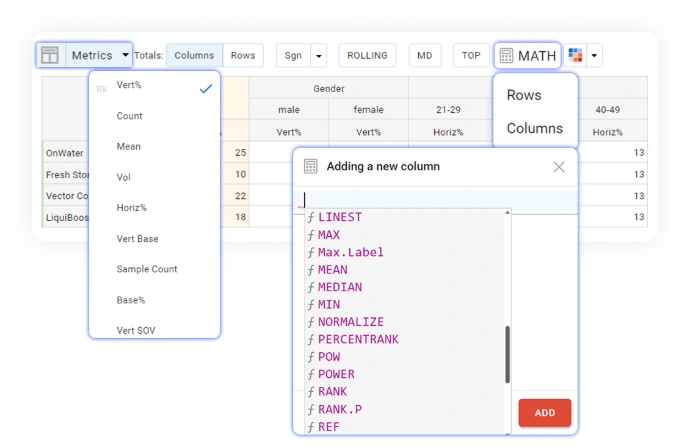
DataTile supports vertical and horizontal percentages, counts, means, weighted and unweighted bases and other research metrics. MATH functions can be used when the analysis needs additional calculations rather than another manual spreadsheet step.
>> Learn more: Using MATH functions in crosstabs
Keep weighting and significance in context
Significance testing is available directly in the crosstab, with settings for weighted bases, low-base handling, multiple thresholds and advanced testing where audiences overlap.


From survey data to dashboards and reports
1. Upload survey data
Bring your survey dataset into DataTile and work with its variables, labels and research structure
2. Build crosstabs
Compare questions and audiences using rows, columns, filters, splits, weights and significance testing
Step 3
3. Visualise results
Turn the analysis into charts when a visual view makes the pattern easier to understand
4. Create dashboards
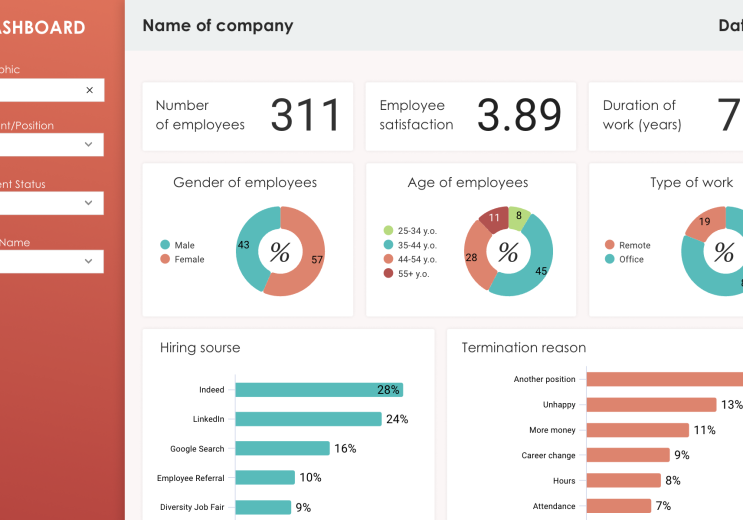
Use the same analysis in interactive dashboards for recurring research, clients or internal stakeholders
5. Export or share
Take results into PowerPoint, Excel, PDF or image formats, or share access to the analysis and dashboards.
Where crosstabs do the heavy lifting
Brand tracking
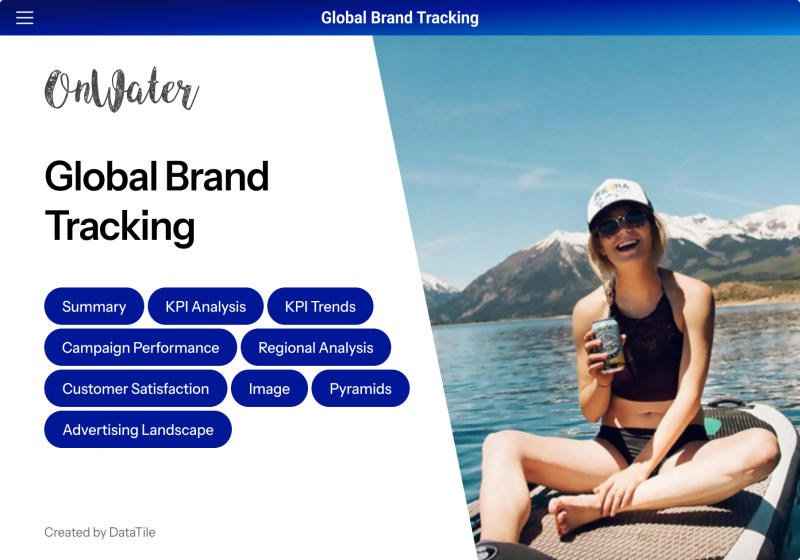
See Brand Health Tracking
Customer experience and NPS
Go beyond the overall score to compare customer groups, regions, touchpoints or other survey cuts and test which differences deserve further attention.
Usage, attitudes and segmentation
Explore how attitudes, behaviours and category usage differ between audiences, then create custom cuts for deeper analysis and reporting.
Research agency reporting
Build consistent analyses across client studies, generate repeated tables more efficiently and move results into dashboards, PowerPoint or Excel without treating tabulation and reporting as separate jobs.
DataTile for Research Agencies
In-house insight brand teams
In-house insight teams can use the same crosstab workflow to investigate tracker and CX data before publishing the results to a wider stakeholder audience.

See crosstab analysis in a real research workflow
Read JICMAIL’s Discovery 3.0 announcement
FAQ about crosstab analysis in DataTile
Crosstab software helps researchers compare survey results across different variables or groups — for example by age, market, customer type, wave or another audience segment. It makes it easier to see where results differ instead of relying only on overall totals.
Yes. Survey categories can be combined using logical conditions for ad-hoc analysis, while reusable audience definitions can be saved as logical variables for later use.
Yes. DataTile can apply pre-calculated weight variables supplied with the dataset, including multiple weights. Significance testing can also be applied directly in the crosstab, with configurable base rules, thresholds and advanced testing for overlapping audiences.
DataTile Knowledge Base and Support
Yes. DataTile supports multi-response structures built from several related variables, including common dichotomous and categorical survey formats as well as quantitative structures.
Yes. You can turn a crosstab into a chart, add it to a DataTile dashboard, or export it to PowerPoint, Excel, PDF, or an image file.

Want to see how DataTile handles your survey data?
Bring a study you already know. We can show you how DataTile handles the cuts, segments, statistical comparisons and reporting workflow around it.