


From survey data to decision-ready dashboards — in hours, not weeks
DataTile is a research analysis and reporting platform that turns survey and tracking data from SPSS, Excel and other sources into interactive dashboards and automated recurring reports — so Brand, CX, HR, and Product teams get answers without waiting for decks.
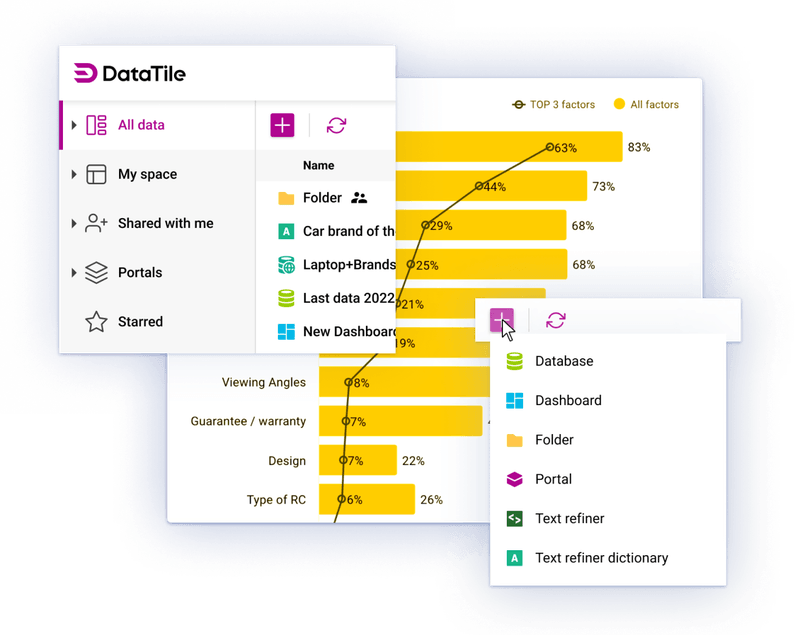







DataTile is a survey reporting platform for internal teams that run surveys at scale and need results people actually use
This is the best reporting tool for:
If you manage brand, CX, HR, product, or market research data — and spend too much time turning raw files into reports —
DataTile replaces manual prep and scattered tools with interactive survey dashboards and automated recurring reports that stay consistent across waves and markets.
Head of Insights &
Research Director
Owns data quality, comparability, and insight impact across studies, waves, and markets.
Research Operations &
Analytics Lead
Drives speed, standardisation, and automation across survey reporting workflows.
Brand, CX &
Marketing Lead
Relies on timely, trusted insights to guide brand, product, and customer decisions.
HR Director &
People Analytics Lead
Tracks engagement, performance, retention, and workforce trends to support better people decisions.
Why Teams Choose DataTile
Deliver insights days faster
70%
less time spent on survey data prep and reporting. Insight teams focus on decisions not data cleaning, spreadsheets making and charts reformatting.
Scale recurring reporting without adding headcount
30%
more studies delivered by the same team. Automation handles wave updates, segment cuts, and dashboard refresh — so recurring reports don’t create recurring workload or hurt ROI.
Drive adoption of survey dashboards across the organisation
40%
more teams using research every week. Clear, consistent interactive dashboards replace scattered files — so insights are seen, shared, and acted on by Brand, CX, HR, and leadership.
- Consistent, professional-quality outputs every time: Reusable templates and automated QC ensure every dashboard and report meets the same standard — even across multiple brands, categories, or vendors.
- Faster onboarding for analysts and managers: Guided setup and repeatable survey reporting workflows help new team members become productive in days, not weeks.
- Better cross-team collaboration: Brand, CX, digital, HR, and compliance teams work from the same dashboards, reducing rework, misalignment, and version confusion.
- Enterprise-ready governance and compliance: SOC-2-ready, GDPR-compliant infrastructure with role-based access ensures secure, auditable insight sharing across the organisation.
- Seamless fit into your existing research stack: Works with Qualtrics, SurveyMonkey, Typeform, and local vendors — consolidating fragmented research tools into one survey reporting platform.

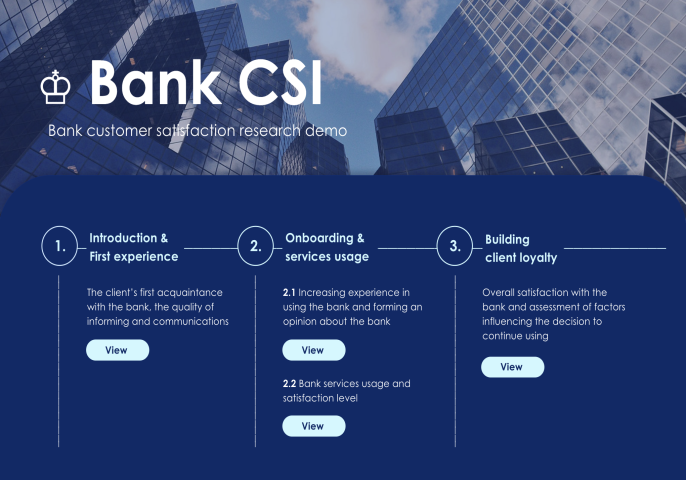
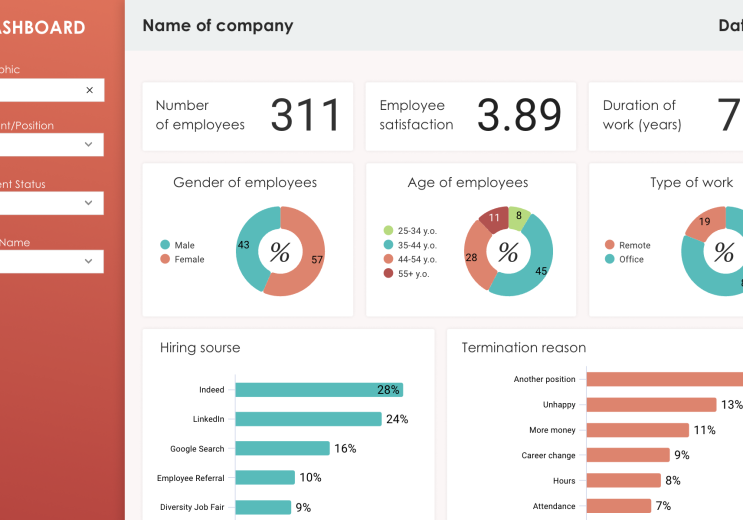
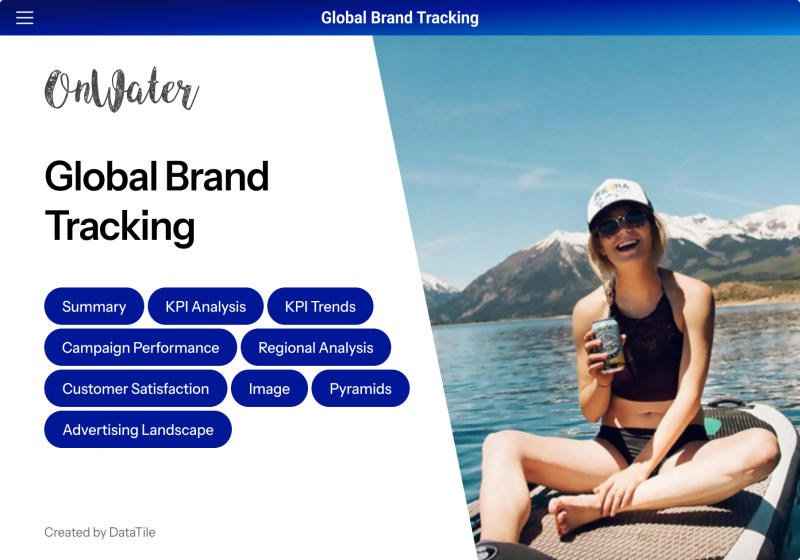
Core survey reporting workflows
Explore the most common survey reporting workflows — and see how dashboards and recurring reports update automatically as new data arrives.
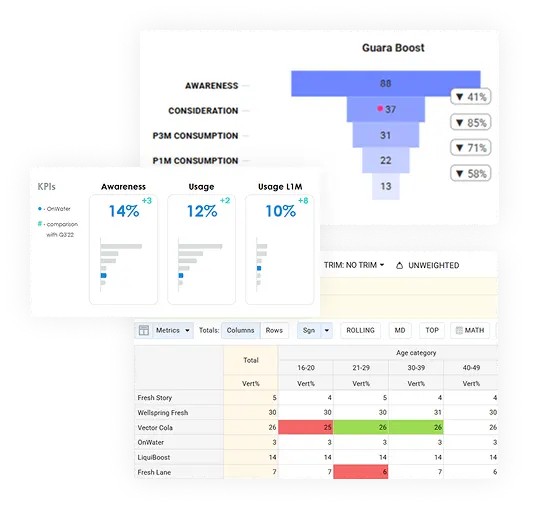
Brand Health Tracking
Track awareness, consideration, preference, and brand KPIs across segments for BHT — with consistent outputs your stakeholders trust.
Inside this workflow you get:
- Segment-ready crosstabs for demographics, usage, and audiences
- Built-in significance testing to validate changes and differences
- Standardised dashboard widgets for KPIs, trends, and comparisons
- Shareable views for leadership — without rebuilding decks every wave
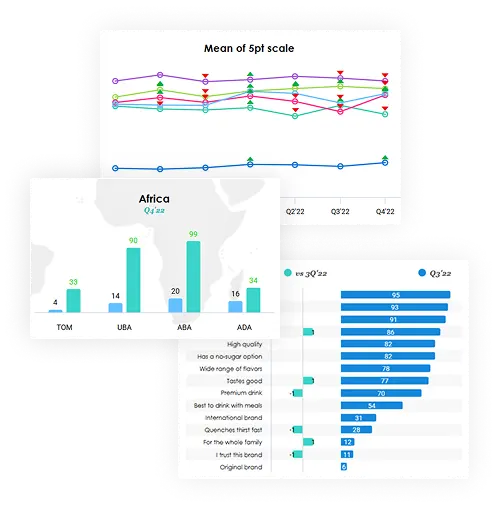
Global Brand Tracking multi-market, multi-wave
Compare markets and waves without breaking labels or reporting structure — even when data comes from different vendors.
Inside this workflow you get:
- Multi-dataset joins for waves, trackers, and markets
- Meta / variable management to keep structures aligned
- Repeatable cuts across countries, segments, and time periods
- Dashboards that stay comparable over time because they are built for recurring reporting
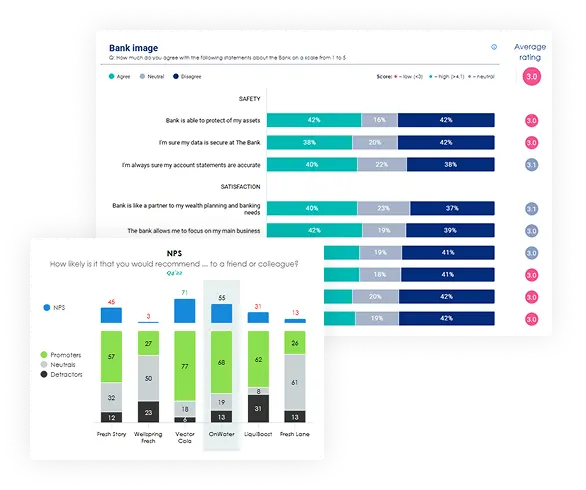
Customer Satisfaction: CSI , NPS, service quality, drivers
Turn continuous CX measurement into decision-ready reporting that teams can use weekly — not quarterly.
Inside this workflow you get:
- KPI tracking for NPS / satisfaction / resolution / touchpoints
- Filters and cuts by channel, region, customer type, and cohort
- Statistical testing to separate signal from noise
- Dashboards designed for cross-team consumption (CX, product, ops)
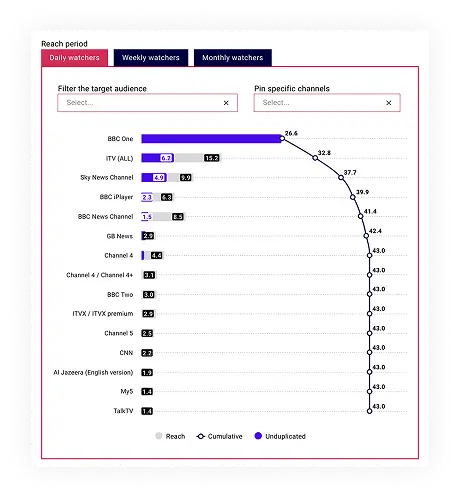
TURF Analysis: reach & portfolio optimisation
Run TURF scenarios to maximise unduplicated reach — without exporting to separate tools.
Inside this workflow you get:
- Built-in TURF module for scenario simulation
- Clear outputs for optimal sets + reach curves
- Fast iteration across audiences/segments
- TURF results published into a shareable dashboard
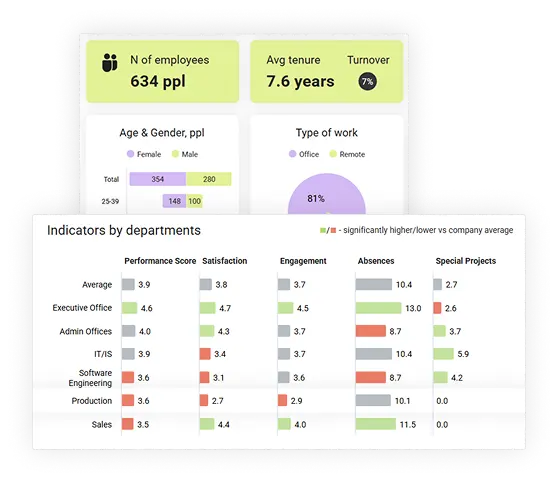
HR Analytics Dashboard: engagement, retention, recruitment
Combine HR survey data and operational metrics into dashboards leaders can use to act on engagement, performance, and retention trends.
Inside this workflow you get:
- Cuts by department, location, tenure, role level, cohort
- Trend tracking for engagement, attrition signals, hiring funnels
- Interactive dashboards that reduce “re-cut this” requests
- Safe sharing to leadership with controlled access
... and there are more platform features which most teams use across their workflows:
- Dashboard building & publishing:
Dashboard settings, widget settings, chart types, chart publishing & embedding
- Sharing & access control:
Sharing and Access Management, Advanced Sharing, public link access where appropriate
- Integration & automation for recurring reporting:
Dashboard Data API, API for import/export codebooks, embedding, cross-server synchronisation (mention only if relevant to your buyers)
- Data loading (SPSS .sav, Excel) + dataset setup:
Data Loading, Database Settings, Meta-editor functionality, Multi-response sets
- Crosstabs & segmentation cuts:
Beginner + Advanced Crosstabulation, full-screen mode, filters and segment logic
- Statistical & advanced analytics:
Significance testing (t-test / z-test), TURF, cluster analysis, Text Refiner for open-end coding

Try DataTile for free
Isn’t it time you transformed your business? Try DataTile for free and see how it can enhance your productivity with it’s thorough analysis, interactivity and speed.
Used across research-heavy industries
Same workflows — different datasets
FMCG
Brand tracking, Innovation, Pack tests
Financial Services
CSI / NPS, Brand trust, Journey
Retail & E-commerce
CX, Shopper, Category
Public sector & Social impact
Perception, Reporting
Telecom
Churn, NPS, Service quality
Travel & Hospitality
Experience, Route / property, NPS
Tech & SaaS
Ad testing, Segmentation, Tracking



We’re happy with our collaboration with DataTile. Our strategic client was able to achieve greater flexibility and has significantly improved the speed of obtaining operational data. Moreover, it streamlined access to research data for final users and as a result accelerated their business-decision making process.
—Rimantas Reimontas,
Managing Director at Fastuna EU
They’ve thought of everything to make life simpler and easier for a researcher to analyse and visualise by eliminating the heavy lifting and giving back time that can be spent getting the insights out of data. We can now analyse and present our data with speed and ease, often within hours of fieldwork closing.
—Sarah Gale, Director of Research & Insight
FAQs
No. DataTile is a survey reporting platform built for insight and analytics teams, not developers.
You work in a visual interface: upload survey data, run crosstabs, apply filters, and publish interactive dashboards — no code required..
Not at all. You can start with guided workflows and reusable templates for survey reporting, then go deeper as needed.
Many teams use DataTile productively from day one, even if only a few users handle advanced analysis.
Most teams can upload survey data and publish a first dashboard within a day.
Multi-wave or multi-market setups may take longer initially — but become much faster with reusable templates and recurring reporting workflows.
You can import SPSS (.sav), Excel (.xlsx), CSV, and tab-delimited survey files.
Outputs are delivered as interactive survey dashboards and can be exported for reporting workflows when needed.
Yes. You can share survey dashboards with filters, dropdowns, and interactive cuts so stakeholders can explore results themselves. They can view and interact without editing the underlying analysis.
Yes. DataTile is built with secure access controls and GDPR-aligned data handling. Role-based permissions let you control access to survey data, dashboards, and reports at dataset and user level.
Power BI and Tableau are general BI tools. DataTile is purpose-built for survey reporting and recurring tracking workflows — with native support for crosstabs, weighting, significance testing, templates, and automated recurring reports. Teams spend less time modelling data and more time interpreting results.
Yes. You can combine survey datasets across waves or countries and keep outputs aligned for side-by-side comparison or trend tracking — ideal for global tracking and recurring survey reporting.
When you upload an updated survey file, dashboards refresh automatically. You don’t need to rebuild charts or reformat reports — a key advantage for recurring trackers and automated reporting.
Editors upload data, run analysis, and build dashboards. Viewers can access and interact with dashboards (filters, dropdowns, drilldowns) but can’t change the setup — making it easy to share insights across internal teams.
You get onboarding, documentation, and responsive support to help your team adopt the platform. For larger rollouts, we offer structured training to standardise survey reporting across teams and markets.
DataTile is an insight and survey reporting platform built specifically for survey and tracking workflows. It supports the full process: importing SPSS/Excel data, running crosstabs with weighting and significance testing, and publishing interactive dashboards and automated recurring reports.
FAQs for Research Pros
Yes. If your dataset includes a weight variable (for example from SPSS), you can apply it across cuts. DataTile supports built-in significance testing (e.g. t-test / z-test options depending on setup) directly within survey reporting outputs.
DataTile supports recurring survey reporting across waves and markets. You align variable structures once, then compare or refresh datasets so trends remain consistent over time.
Yes. TURF, correspondence analysis, and cluster analysis are available as built-in modules. You can run these inside the platform without SPSS scripting and publish results into interactive dashboards or exports.
Yes. You can define derived variables, indices, and custom KPIs, then use them in crosstabs, filters, and dashboards across your survey reporting workflows.
Use Text Refiner — a semi-automated text analytics tool for open-end coding. It groups similar words and phrases using dictionaries and rules, then lets you review, edit, and export coded categories for reporting.
Sentiment / semantic analysis is supported via our AI module (availability depends on your plan and rollout stage). It helps classify verbatim responses (positive/neutral/negative) and detect recurring themes for faster qualitative-to-quant reporting.
Yes. DataTile supports common survey platforms via API connections or data import. That means you can automate refreshes as new responses come in and keep dashboards and automated reports up to date.
DataTile uses standard, widely accepted statistical tests. Methods are documented and consistent, and results can be validated against existing tools during onboarding if required.
Statistical modules are benchmarked against SPSS and R for parity on core tests and algorithms. QA checks focus on consistency, reproducibility, and expected research-standard tolerances.
Yes. You can export charts or full dashboards to PowerPoint and Excel templates while preserving branding and slide layouts — ideal for client-ready survey results reports and recurring reporting packs.
Yes. If quota fields or QC flags (e.g., speeders, straight-liners, attention-check fails) are present in your SPSS or Excel file, you can use them as filters and cuts in crosstabs and dashboards — and consistently exclude low-quality completes in your survey results reports and automated reports.

Talk to our team
DataTile professionals will answer all your questions and help you choose the best option for your business.