


Deliver insights faster. Impress every client.
DataTile is a market research reporting platform that automates survey data analysis, crosstabs and interactive survey dashboards, helping research agencies spend less time on manual tabulation and deliver repeatable, client-ready reporting to win accounts.
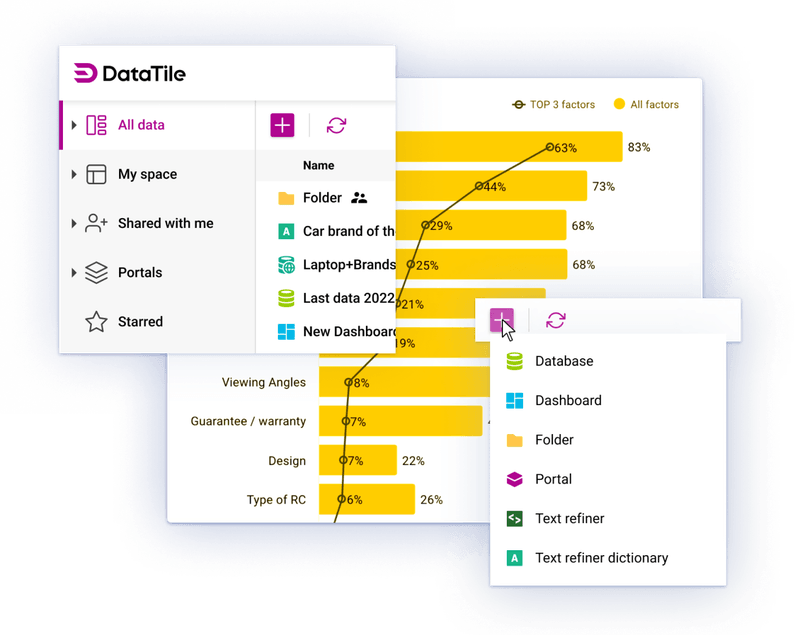







Why Teams Choose DataTile
Deliver interactive dashboards days faster
70%
less time on data prep and reporting. Clients get insights in hours, not weeks.
Scale projects without extra staff
30%
more studies handled with same team. Automation works while analysts focus on insight.
Impress every client, every time
23%
higher NPS in pilot agencies
Interactive dashboards make your work unforgettable.
- Consistent quality across every project: Use shared templates and automated QC rules to keep every dashboard on-brand and error-free.
- Smarter setup, faster ramp-up: Designed for researchers, with guided steps that make cross-tab and dashboard setup easy to learn and repeat.
- Seamless collaboration with clients: Invite clients to view or comment live inside dashboards — no more endless slide revisions.
- Enterprise-level security by default: SOC-2-ready, GDPR-compliant infrastructure built for agencies handling sensitive data.
- Integrates with your existing tools: Connect with Qualtrics, SurveyMonkey, Typeform, or Excel to streamline your current workflow.
Made for research teams who deliver for clients
Whether you’re running trackers, ad hoc projects, or multi-market programmes,
DataTile is a market research reporting platform that turns messy survey outputs
into interactive dashboards, fast crosstabs, and client-ready automated reports —
including polished survey results reports.
Mid-market full-service agency
You run multiple trackers and ad hoc studies in parallel. DataTile standardises your workflow with reusable templates, automated QC, and consistent outputs — so you deliver survey results reports and interactive dashboards faster, without adding analysts.
The best tool for:
- Research Operations Director: Cuts manual data prep and tabulation with automated QC and repeatable crosstabs.
- Research Director: Gets one source of truth across projects with consistent survey results reports and dashboards.
- Managing Director / Agency Principal: Improves margin and capacity by shipping automated reports faster.
Specialist boutique research firm
You win on expertise and narrative in sectors like finance, tech, healthcare, or B2B. DataTile helps you present insights in a premium, client-facing way — combining deep crosstabs with branded interactive dashboards and clean, executive-ready survey results reports.
The best tool for:
- Founder / Managing Partner: Wins and upsells retainers through premium interactive dashboards clients can use.
- Client Services Director: Reduces revisions and accelerates delivery with shareable dashboards and consistent reporting.
- Data Analyst / Research Manager: Automates repetitive prep and focuses on analysis and insight storytelling.
Large global network & research group
You’re tired of fragmented tools, inconsistent templates, and “every office does it differently.” DataTile gives you one governed system to produce consistent automated reports, comparable crosstabs, and shareable interactive dashboards across markets — with control and auditability.
The best tool for:
- CTO / Head of Data: Consolidates legacy tools into a single governed workflow.
- Global Research Director: Ensures consistency and auditability across markets and teams.
- Account Director: Gives clients real-time access to results without manual deck rebuilding.
Fieldwork & data-collection agency
You want to go beyond delivering raw files and Excel tables. DataTile lets you add a high-margin reporting layer: publish client-ready interactive dashboards, generate automated reports, and provide insight-ready outputs that clients can use immediately for their survey results reports.
The best tool for:
- Operations Lead: Turns raw fieldwork data into polished deliverables in hours.
- Business Development Manager: Adds a high-margin analytics layer to proposals.
- Data Processing Specialist: Eliminates repetitive formatting, merges, and manual reporting steps.

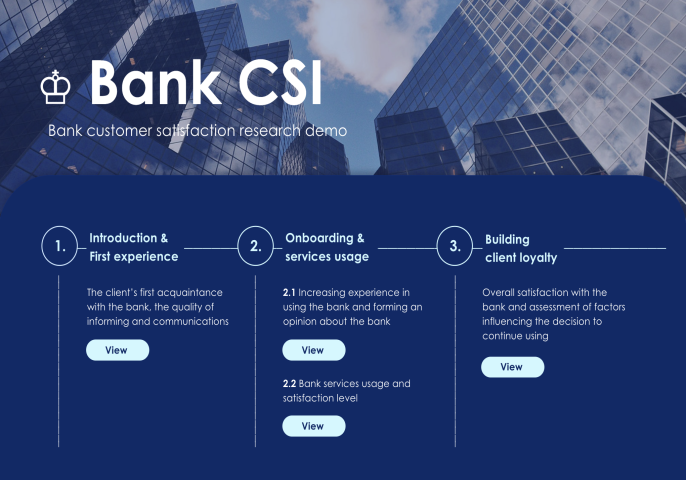
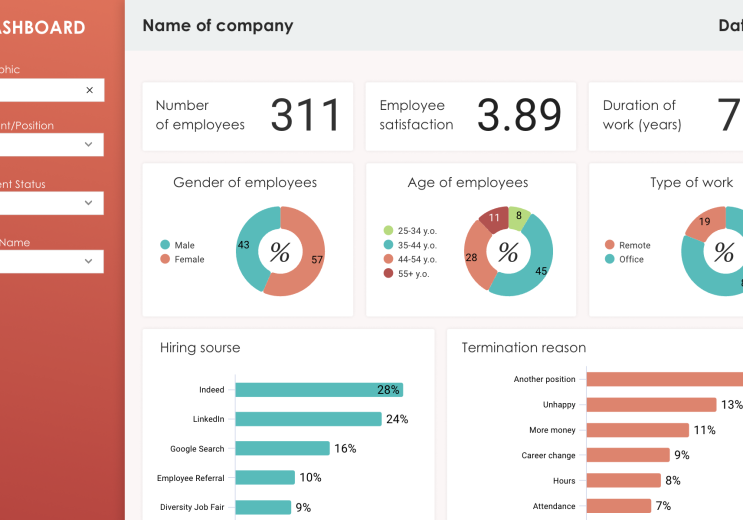
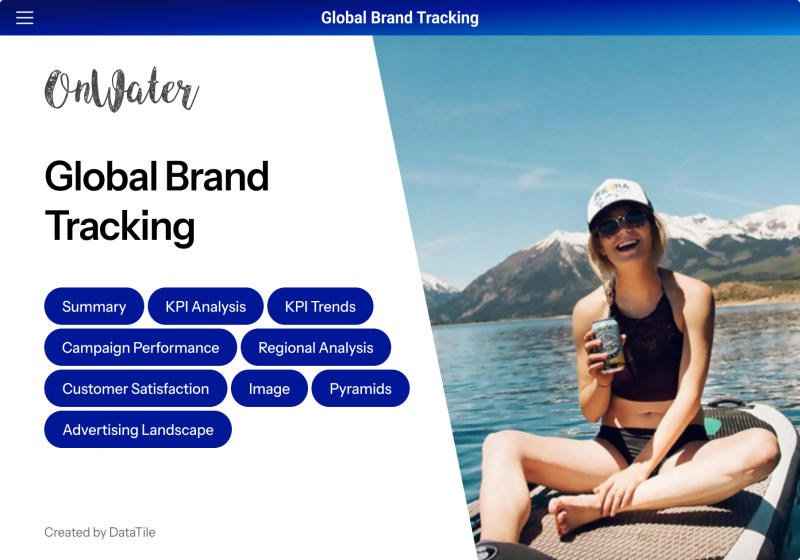
The Engine Behind Faster Insights
Main Features
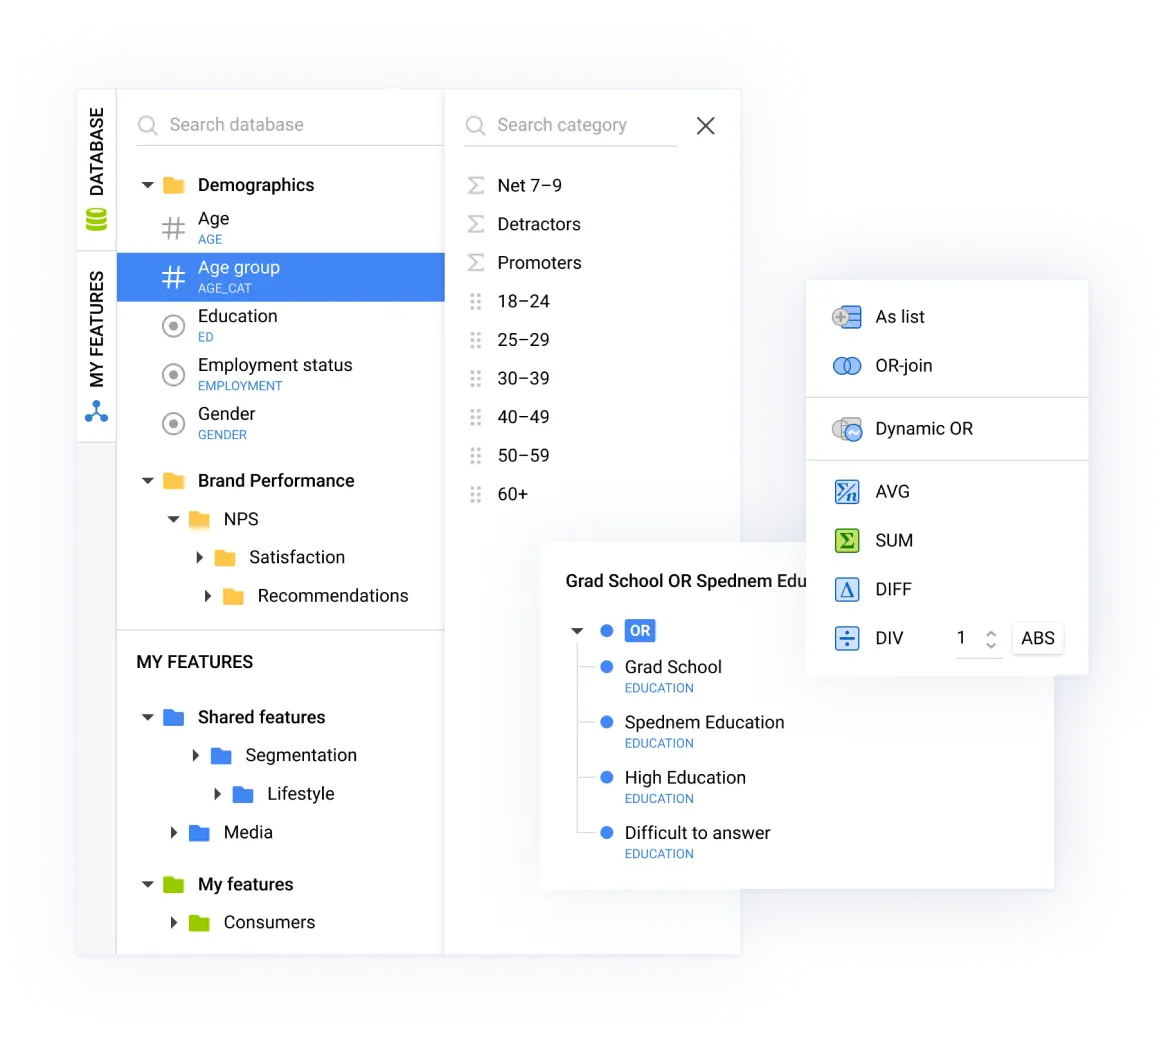
Turn survey data into analysis-ready answers
Upload SPSS (.sav) or Excel, build crosstabs, apply filters, and analyse thousands of variables in one workspace.
Automate data cleaning, weighting, and significance tests to produce consistent outputs — fast enough to power automated reports and every survey results report.
- Crosstabs & variable management
- Statistical testing, TURF, cluster analysis
- Text Refiner for open-end coding
- Multi-dataset joins (trackers, waves, markets)
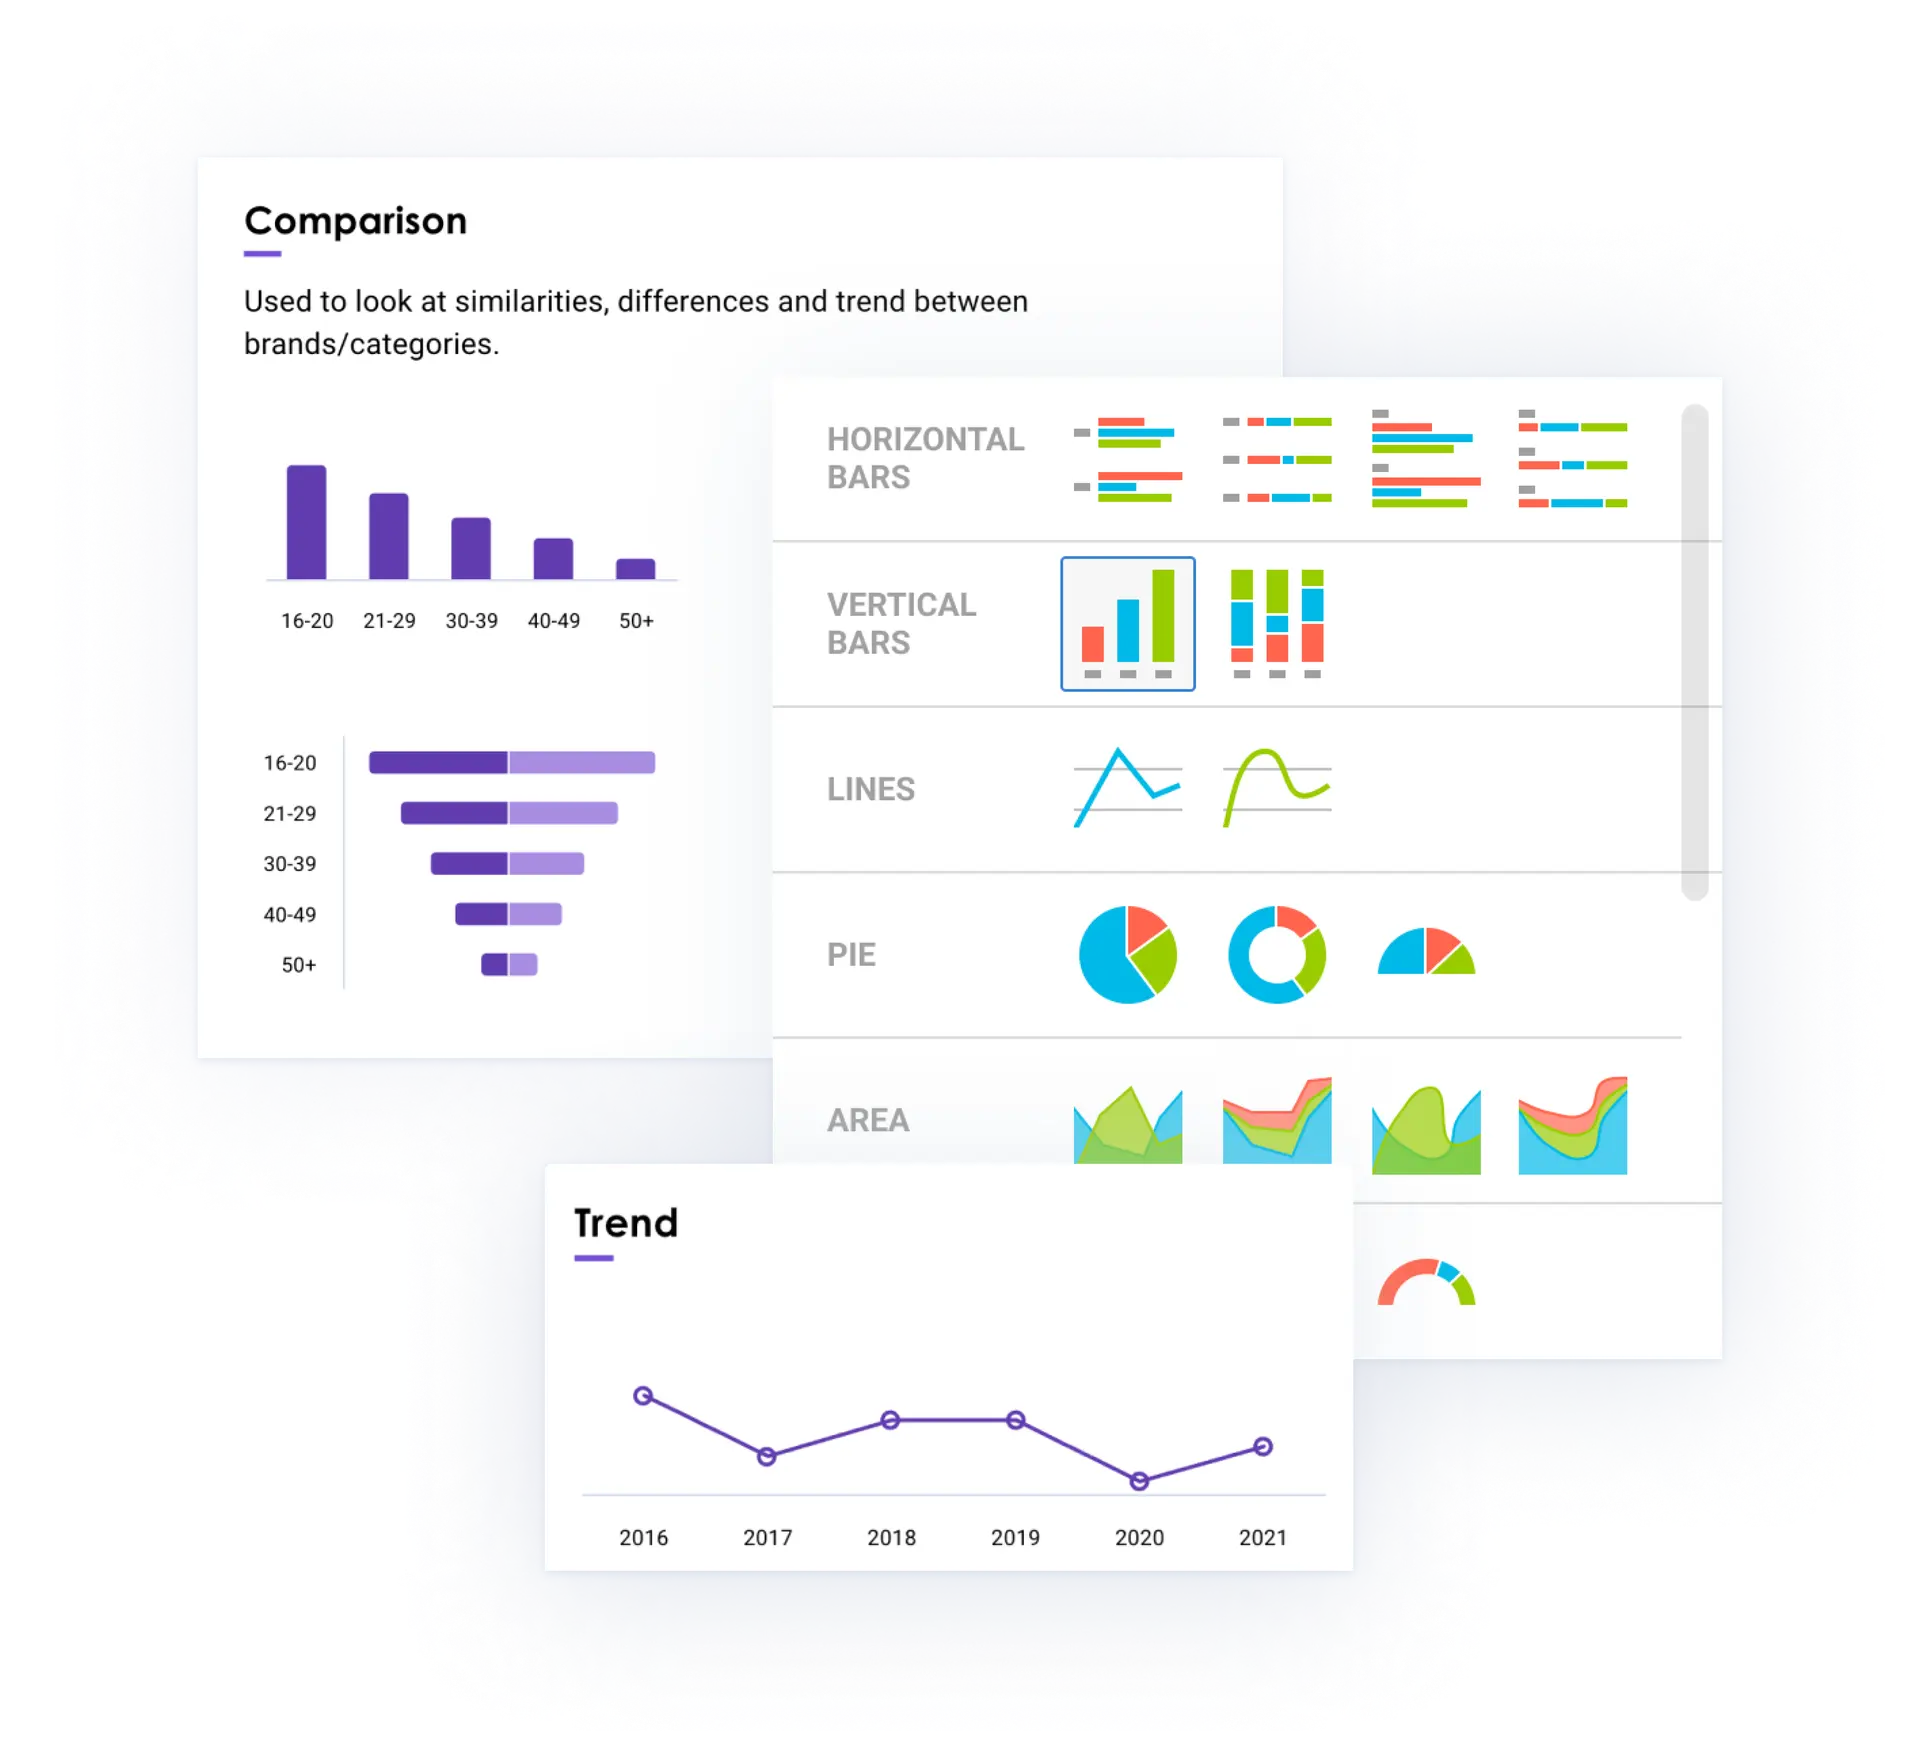
Build interactive dashboards clients can explore
Turn analysis into branded visuals and interactive dashboards your clients can filter, drill into, and share.
Add dropdowns and controls that update every chart instantly — so dashboards replace repetitive slide edits and speed up delivery of survey results reports and automated reports.
- Chart builder & theme controls
- Dynamic filters and controls
- Dashboard sharing & embeds
- PowerPoint / Excel exports
One market research reporting platform for every client project
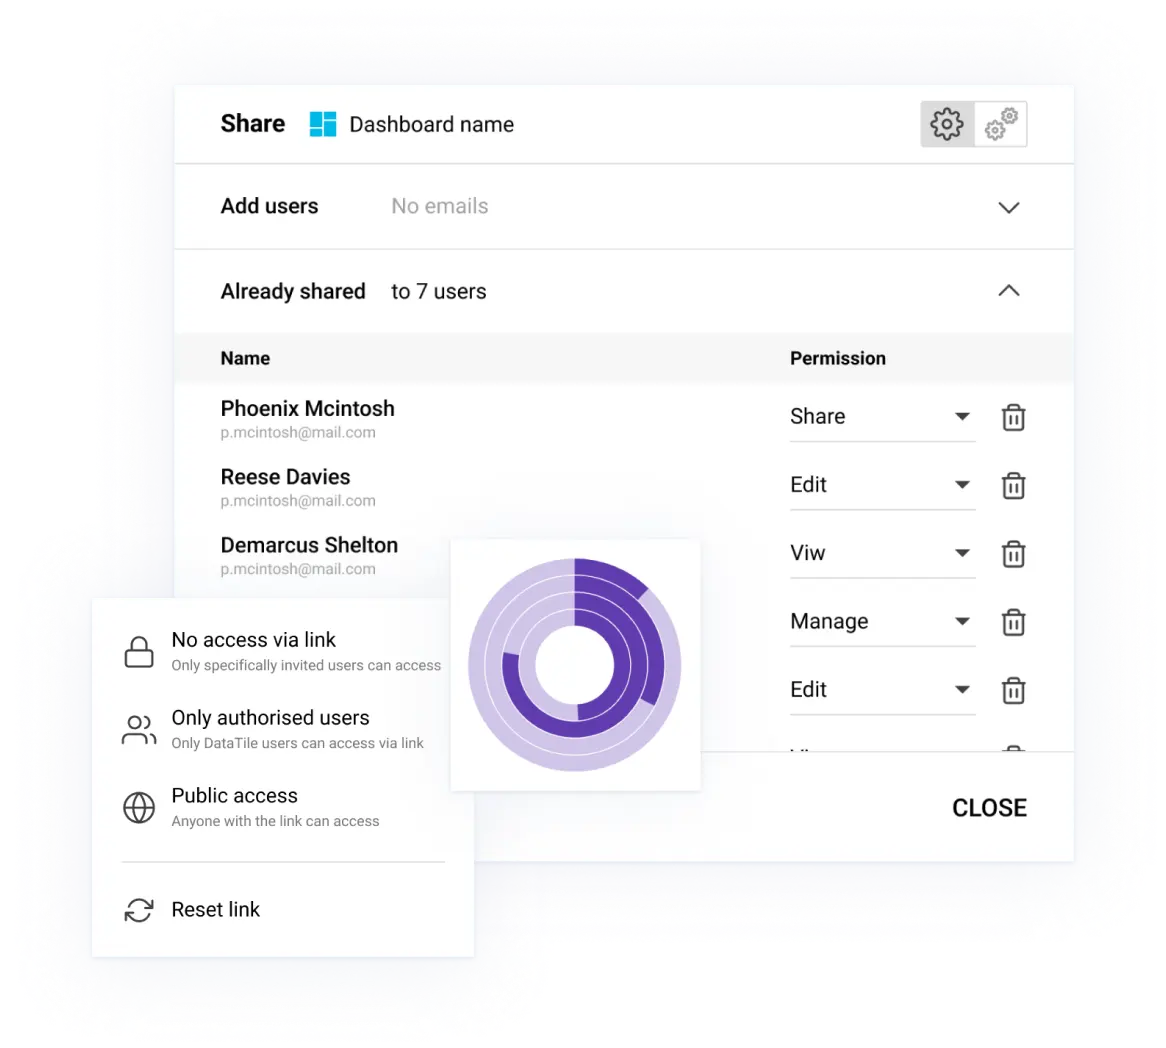
Manage teams, clients, permissions, and deliverables in a secure, GDPR-ready environment built for agencies.
Pay only for editors - viewers are free. Give each client controlled access to live results, and standardise delivery across projects with reusable templates and governed workflows.
- User management & access rights
- Secure cloud servers (SOC-2 ready)
- Reusable project templates
- Role-based editing and sharing

Try DataTile for free
Isn’t it time you transformed your business? Try DataTile for free and see how it can enhance your productivity with it’s thorough analysis, interactivity and speed.



We’re happy with our collaboration with DataTile. Our strategic client was able to achieve greater flexibility and has significantly improved the speed of obtaining operational data. Moreover, it streamlined access to research data for final users and as a result accelerated their business-decision making process.
—Rimantas Reimontas,
Managing Director at Fastuna EU
They’ve thought of everything to make life simpler and easier for a researcher to analyse and visualise by eliminating the heavy lifting and giving back time that can be spent getting the insights out of data. We can now analyse and present our data with speed and ease, often within hours of fieldwork closing.
—Sarah Gale, Director of Research & Insight
FAQs
No. DataTile is built as a market research reporting platform for researchers, not developers.
You work through a visual interface — upload data, run crosstabs, apply filters, and build interactive dashboards with no code.
Not at all. If you’re new to crosstabs, you can start with templates and guided setup.
We also provide short tutorials and onboarding videos, and you can book a walkthrough with our team.
If you prefer, we can set up your first project end-to-end based on your brief.
Most agencies upload data and build their first dashboards within a day.
More complex tracker logic (multiple waves, weighting, or custom views) can take longer — but setup becomes faster over time with reusable templates and standardised workflows.
You can import SPSS (.sav), Excel (.xlsx, .csv), and standard tab-delimited files.
Outputs can be shared as interactive dashboards or exported to PowerPoint and Excel for client-ready survey results reports and automated reports.
Yes. You can share interactive dashboards with live filters and dropdowns. Clients can explore results in real time without editing access — so they get answers faster and you reduce revision cycles.
Yes. DataTile is built for agency work and hosted on secure, GDPR-compliant infrastructure. Role-based access control ensures each client and colleague sees only what they should.
Power BI and Tableau are great general BI tools. DataTile is purpose-built for market research reporting — with survey workflows, crosstabs, statistical testing, templates, and PowerPoint automation designed for agency deliverables.
Yes. You can merge datasets to create unified dashboards — ideal for trackers, multi-wave projects, and multi-country reporting.
When you upload an updated file (for example, a new wave), dashboards refresh — no need to rebuild charts or reformat slides from scratch. This is one of the biggest advantages for recurring automated reports and trackers.
Unlimited viewers are included. You only pay for editors — the researchers who upload data, run crosstabs, and build dashboards — while clients can view and explore results freely.
Every agency account includes onboarding, help documentation, and live support. Enterprise plans include tailored training and dedicated support for multi-team rollout.
DataTile is a market research reporting platform built specifically for survey workflows and agency deliverables.
Unlike general BI tools (like Power BI or Tableau), DataTile is designed for survey data analysis and reporting end-to-end: importing SPSS (.sav) and Excel files, running crosstabs with weighting and statistical testing, and producing interactive dashboards, automated reports, and client-ready survey results reports with reusable templates and controlled sharing.
FAQs for Research Pros
Yes. You can apply weights manually or import them from SPSS (.sav). DataTile supports configurable significance testing (e.g., t-test, z-test, chi-square) and confidence levels, shown directly in your crosstabs and outputs.
You can join datasets across waves or markets, align variable labels, and visualise results side-by-side or over time — ideal for continuous trackers and global studies. This also makes recurring survey results reports and automated reports far faster to produce.
Yes. TURF, correspondence analysis, and cluster analysis are available as built-in modules. You can run these inside the platform without SPSS scripting and publish results into interactive dashboards or exports.
Yes. Advanced users can define derived variables, compute indices, and apply logic to create custom KPIs, segments, and scoring models — then use them in crosstabs, filters, and dashboards.
Use Text Refiner — a semi-automated text analytics tool for open-end coding. It groups similar words and phrases using dictionaries and rules, then lets you review, edit, and export coded categories for reporting.
Sentiment / semantic analysis is supported via our AI module (availability depends on your plan and rollout stage). It helps classify verbatim responses (positive/neutral/negative) and detect recurring themes for faster qualitative-to-quant reporting.
Yes. DataTile supports common survey platforms via API connections or data import. That means you can automate refreshes as new responses come in and keep dashboards and automated reports up to date.
Editors upload data, run crosstabs, and build dashboards. Viewers can interact with dashboards (filters, dropdowns, drilldowns) but can’t change the underlying analysis — perfect for sharing results with agency clients securely.
Statistical modules are benchmarked against SPSS and R for parity on core tests and algorithms. QA checks focus on consistency, reproducibility, and expected research-standard tolerances.
Yes. You can export charts or full dashboards to PowerPoint and Excel templates while preserving branding and slide layouts — ideal for client-ready survey results reports and recurring reporting packs.
Yes. If quota fields or QC flags (e.g., speeders, straight-liners, attention-check fails) are present in your SPSS or Excel file, you can use them as filters and cuts in crosstabs and dashboards — and consistently exclude low-quality completes in your survey results reports and automated reports.

Talk to our team
DataTile professionals will answer all your questions and help you choose the best option for your business.