All articles
Join the session
It will also be useful if you want to:
reduce time spent on manual reporting and slide revisions
give clients a more interactive, modern experience without building a larger team
understand when a dashboard genuinely replaces a slide deck and when it does not
hear directly from a peer consultant about what changed in practice — not just in theory
Speaker
Client Success Director
Now serving as Client Success Director at DataTile, Svetlana is passionate about research operations and automation. Today, she focuses on helping research teams streamline their reporting and build intuitive dashboards, ensuring clients get the most practical value out of the DataTile platform.

For many independent consultants, the final report is still the centrepiece of client delivery. A carefully built PowerPoint deck. A polished PDF. A set of charts, tables, findings, and recommendations that summarise weeks of work. And there is nothing wrong with that.
A well-structured presentation is still one of the best ways to tell a clear story, guide stakeholders through the evidence, and land strategic recommendations.
But for consultants working with survey data, tracking studies, customer research, brand health data, concept testing, or segmentation projects, the traditional slide deck has a problem: it often becomes the place where too much manual work goes to hide.
The analysis is done. The thinking is done. The recommendations are clear. But then come the extra crosstabs, the formatting requests, the updated charts, the "can we also see this by age group?", the "can we cut this by region?", the "can we add one more version for the leadership team?", and the inevitable last-minute changes before the client meeting.
For solo consultants and small teams, this is more than an inconvenience. It directly affects profitability, capacity, and positioning.
The PowerPoint trap
Most independent consultants do not lose time because they lack expertise. They lose time because too much of their expertise is trapped inside manual delivery workflows.
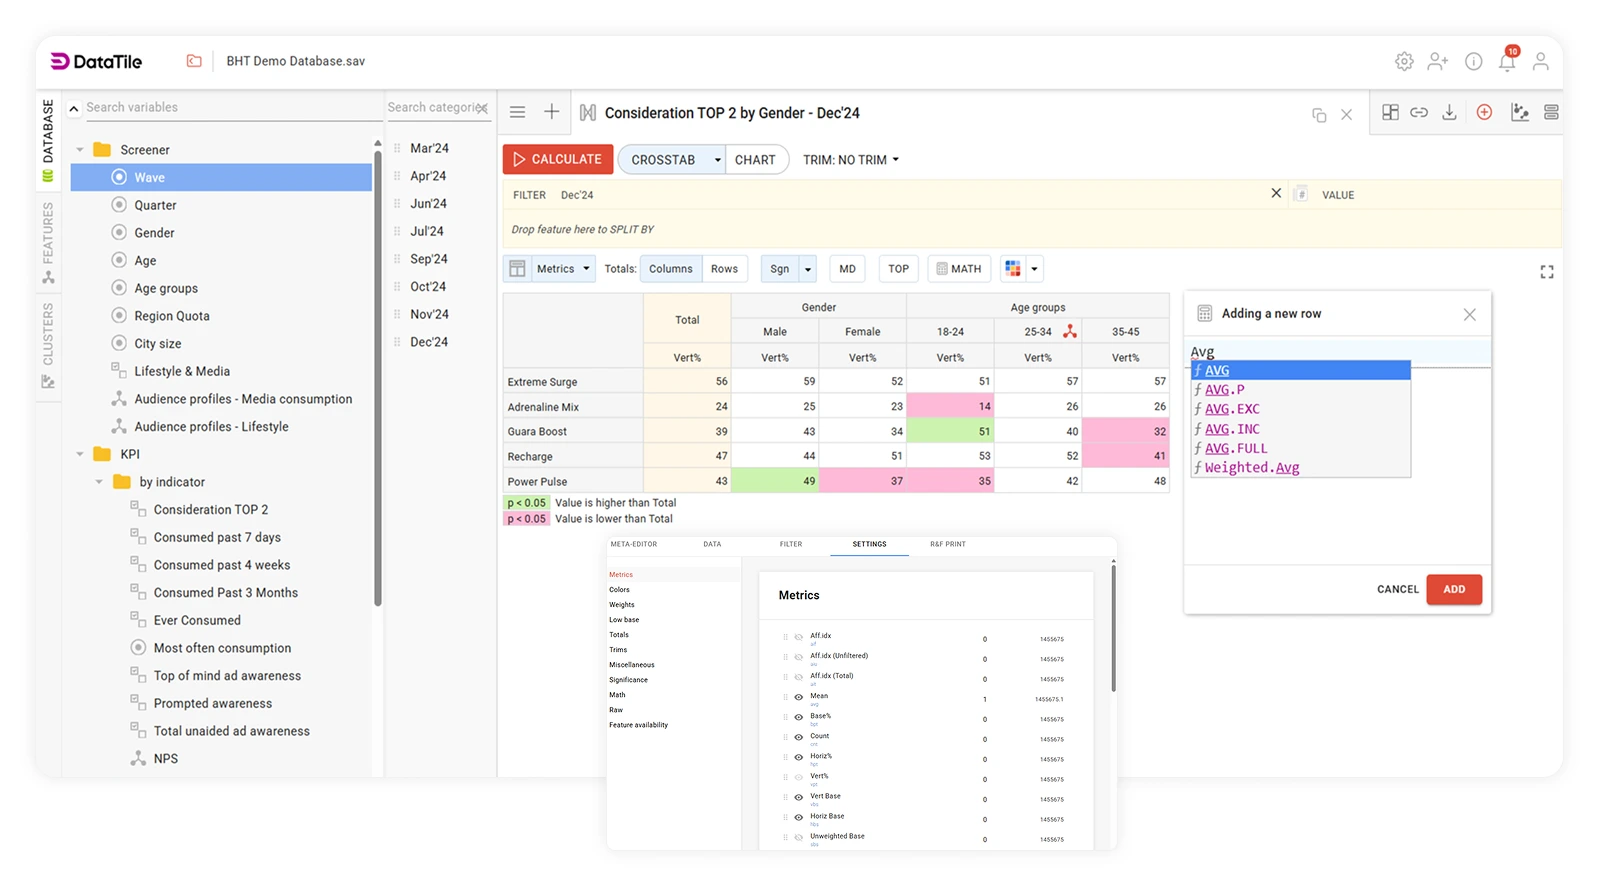
A typical reporting process might look something like this: survey data is exported from one platform, tables are created in another, charts are built manually or semi-manually, slides are assembled in PowerPoint, labels are checked, numbers are copied, segments are re-run. A revised version is sent. Then another. Then another.
This way of working is familiar, and it has real advantages. PowerPoint is easy for clients to understand. It gives the consultant full control over the narrative. It works well for executive summaries, board presentations, and final recommendations.
But it has a cost that rarely appears on any project budget.
A static deck freezes the data at one point in time. It makes every additional question feel like a new task. And it can mean the consultant becomes the person who manually regenerates every chart, table, and cut of the data whenever the client wants to see something slightly differently.
That is where the consultant's role can start to feel smaller than it should. Instead of being valued primarily for strategic interpretation and research expertise, you get pulled back into production mode. Formatting slides. Rebuilding tables. Managing revisions. Checking whether the number on slide 37 still matches the latest table.
The usual alternatives — and why they are not always enough
Some outsource tabulation, dashboarding, or design work. That can work well for larger projects, but it introduces cost, dependency, and turnaround time that does not always fit the economics of a solo practice.
The problem remains: how do you deliver a more modern, interactive, high-value client experience without adding complexity, overhead, or a bigger delivery team behind you?

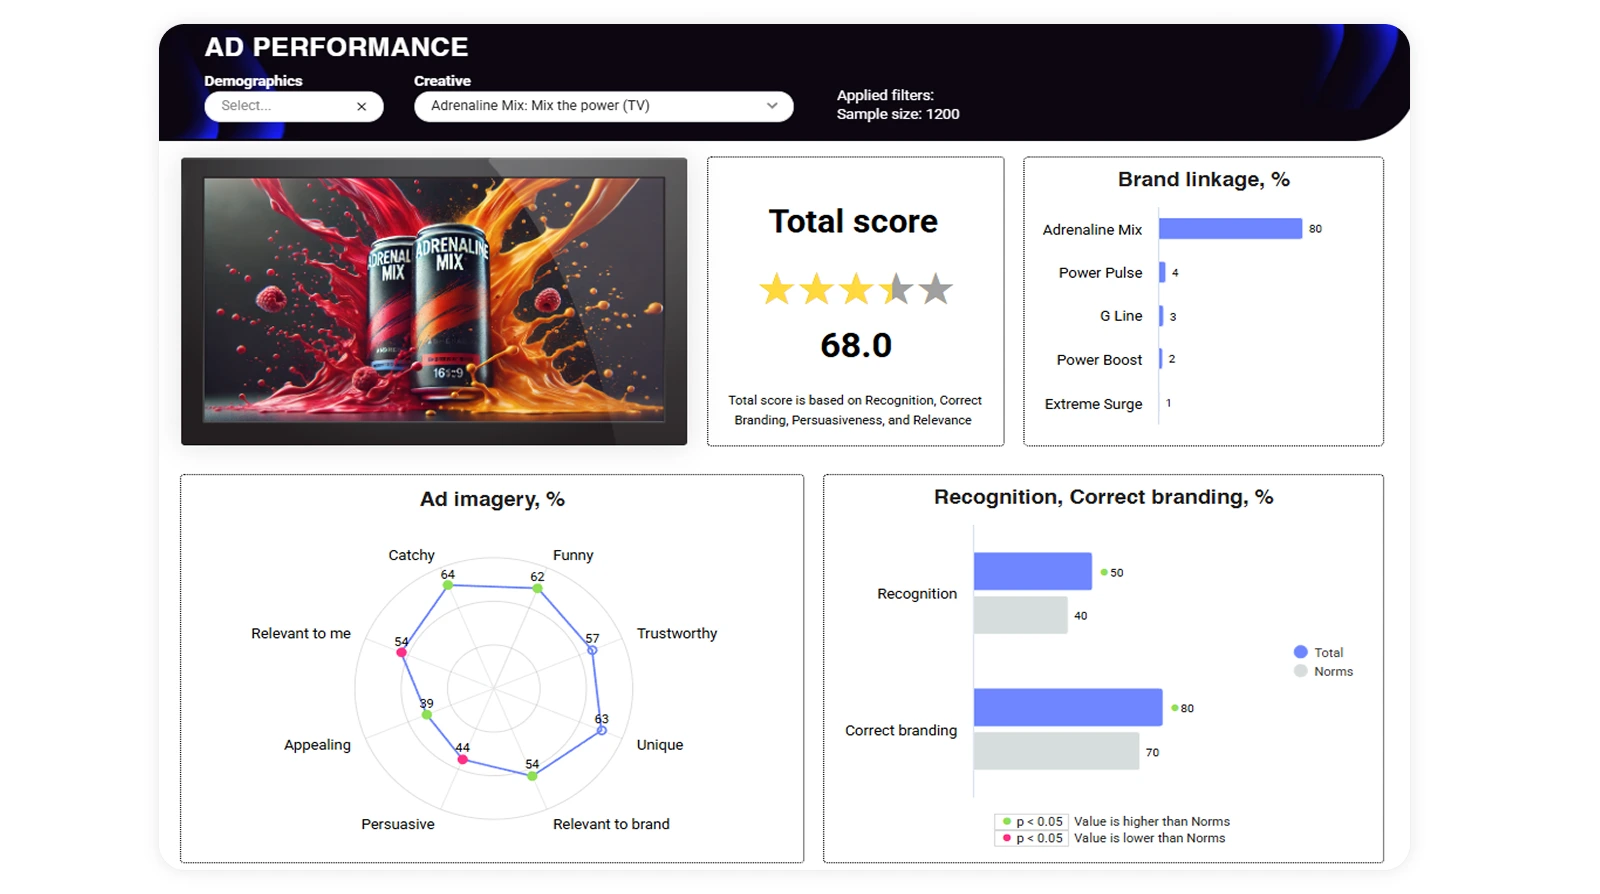
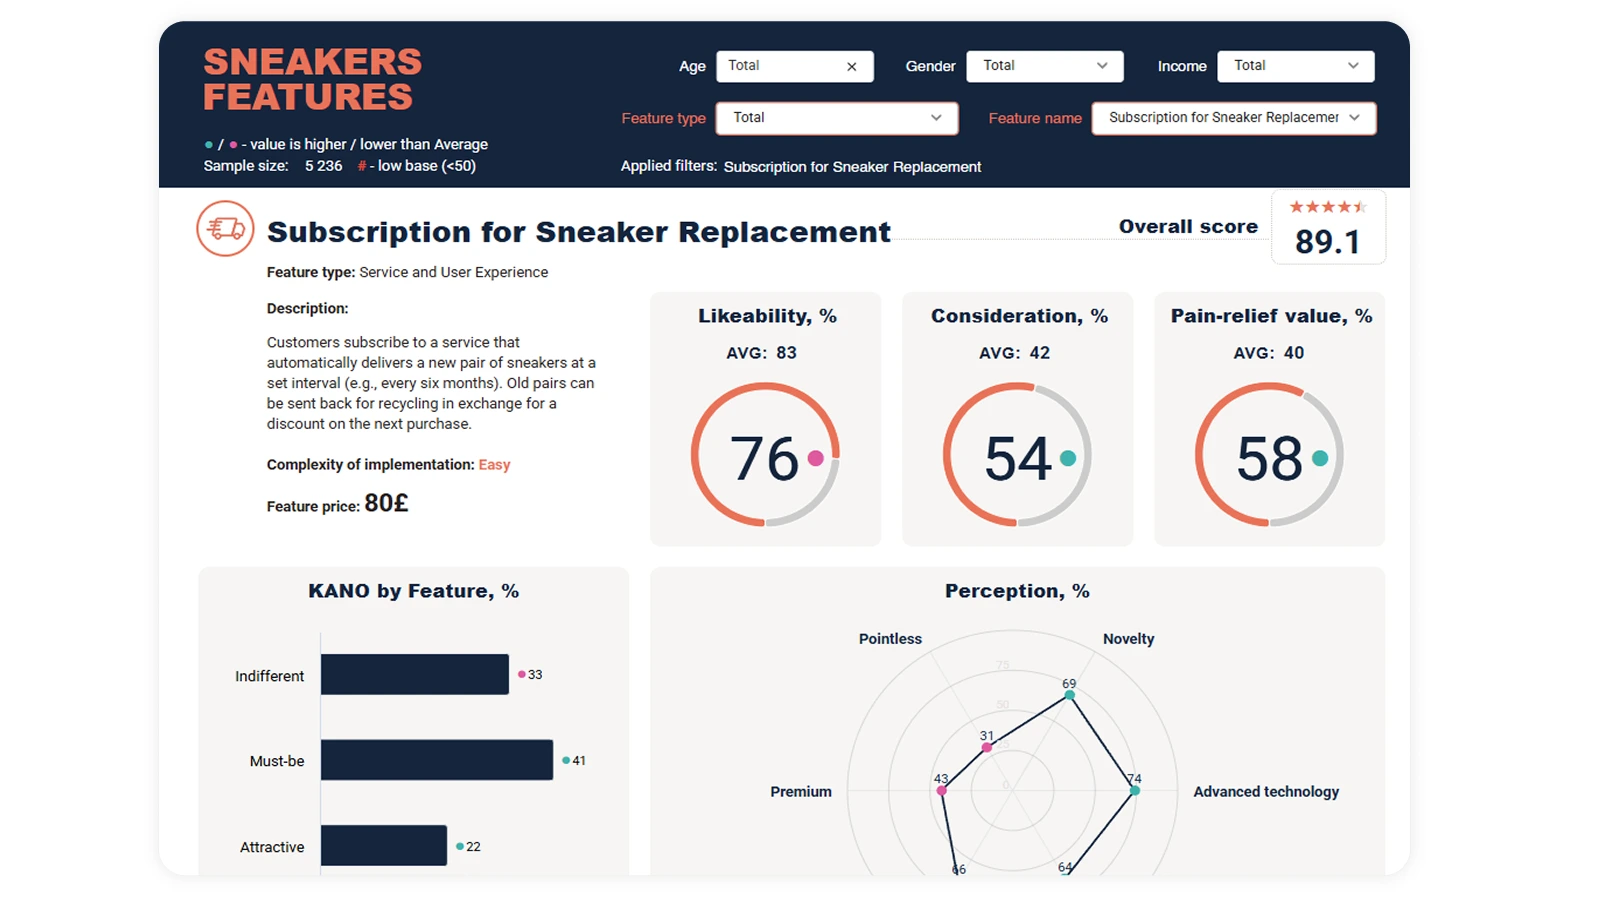
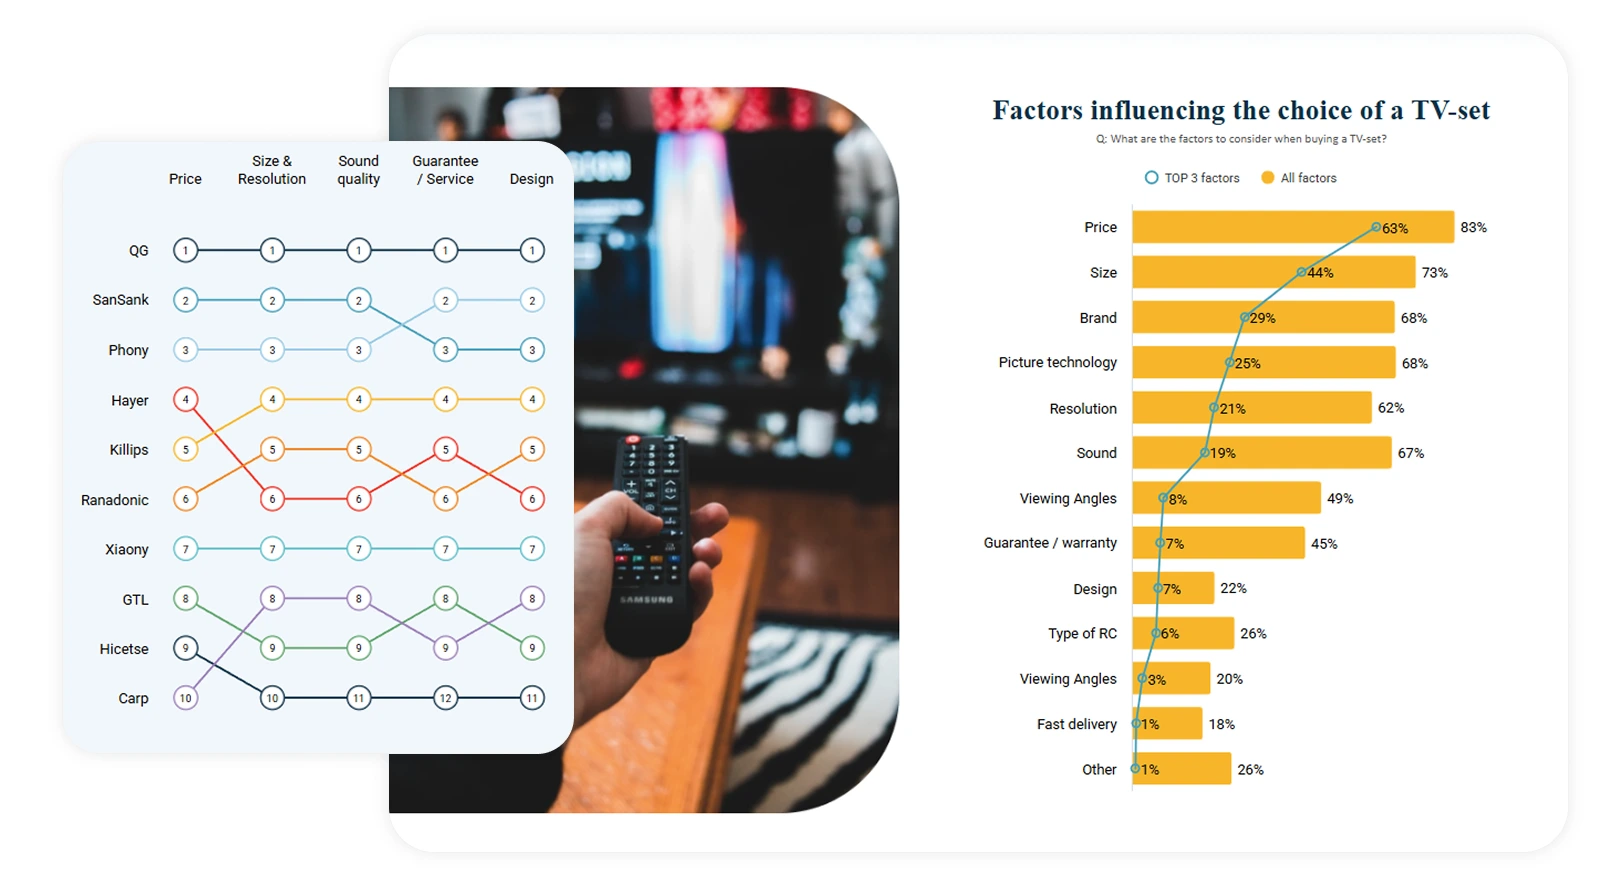
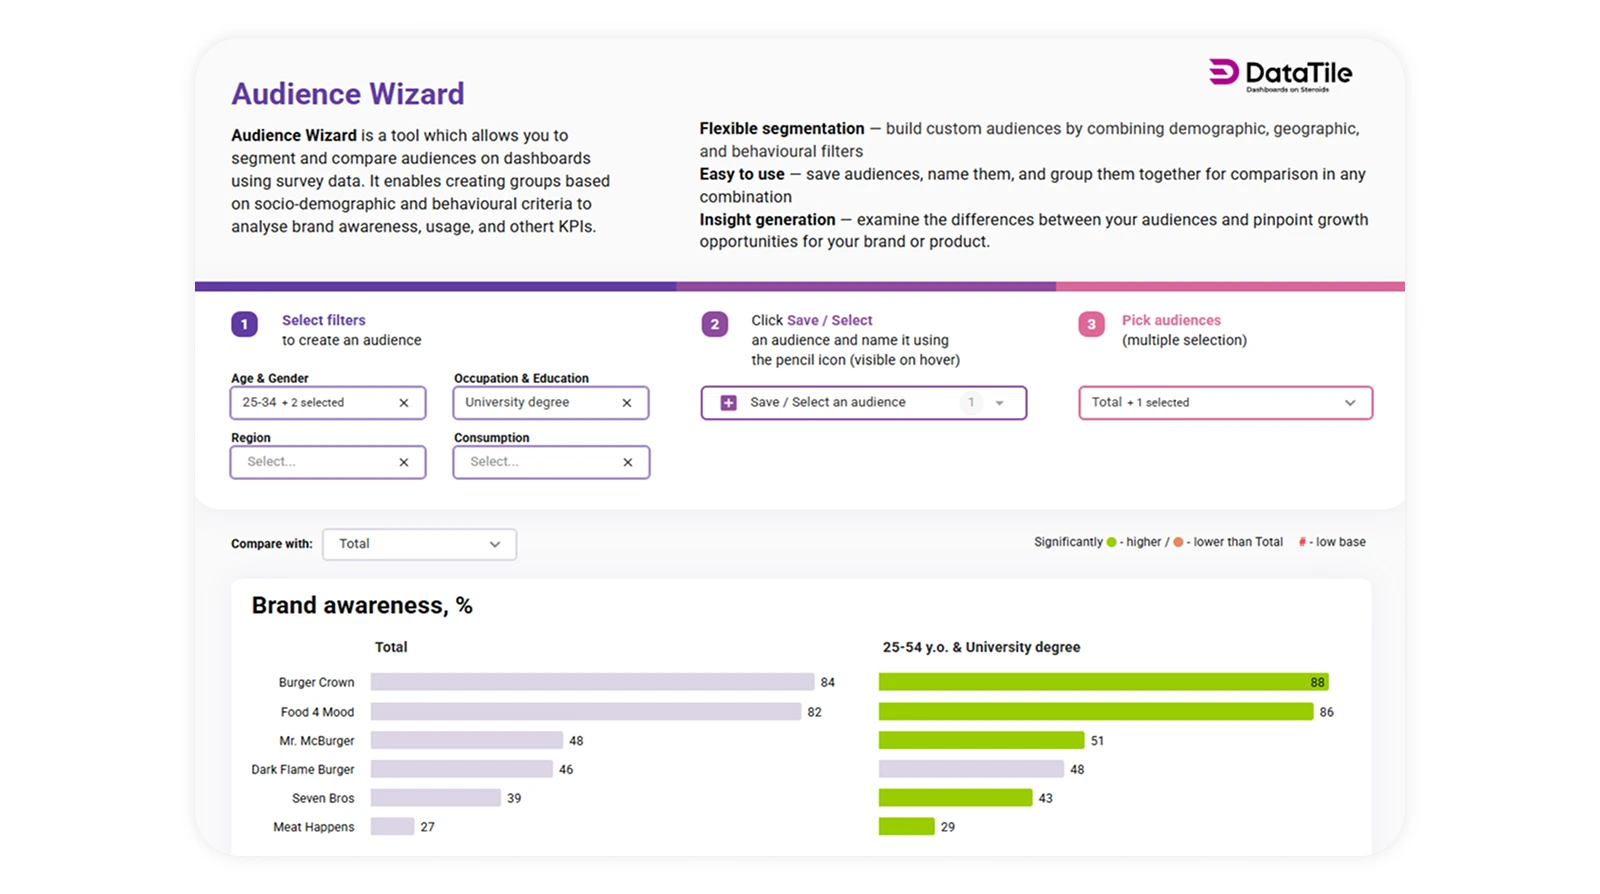
Why dashboards change the consultant-client relationship
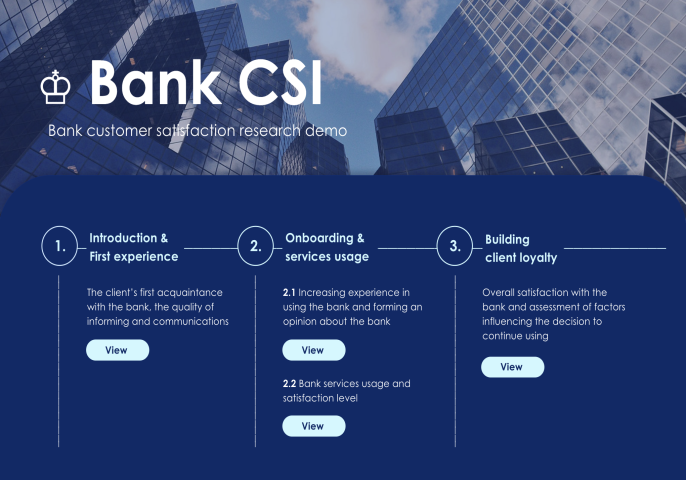
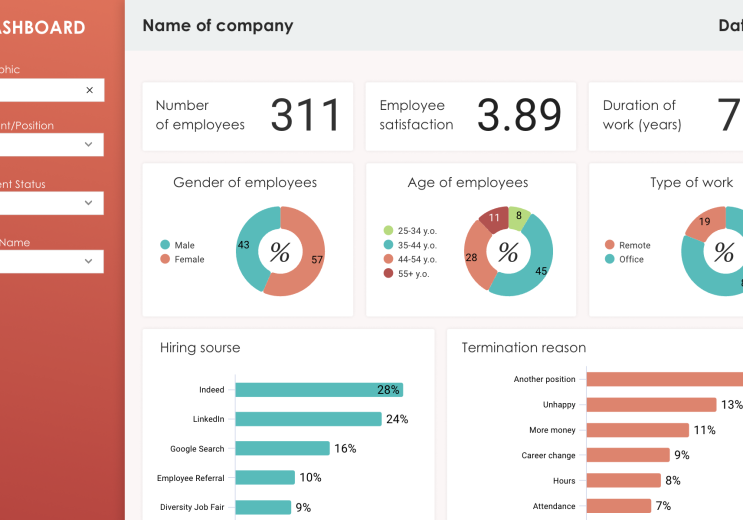
For the consultant, this means something important: less time acting as a production resource, more time acting as a strategic advisor.
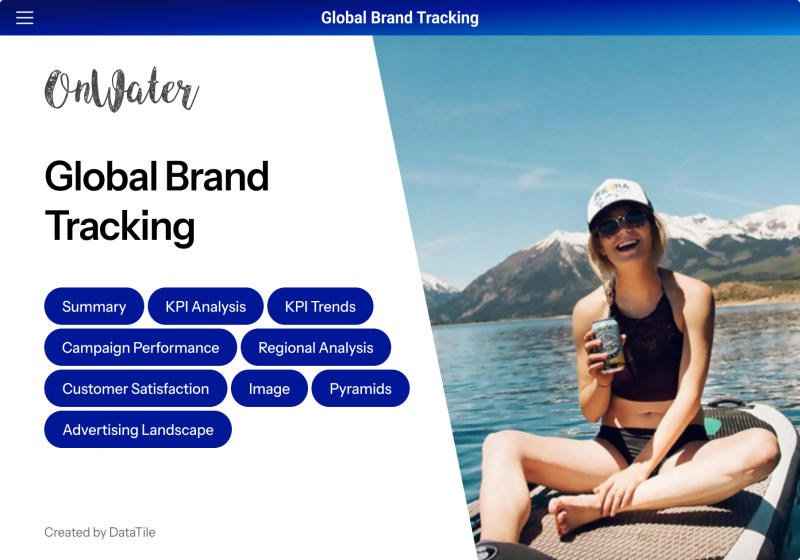
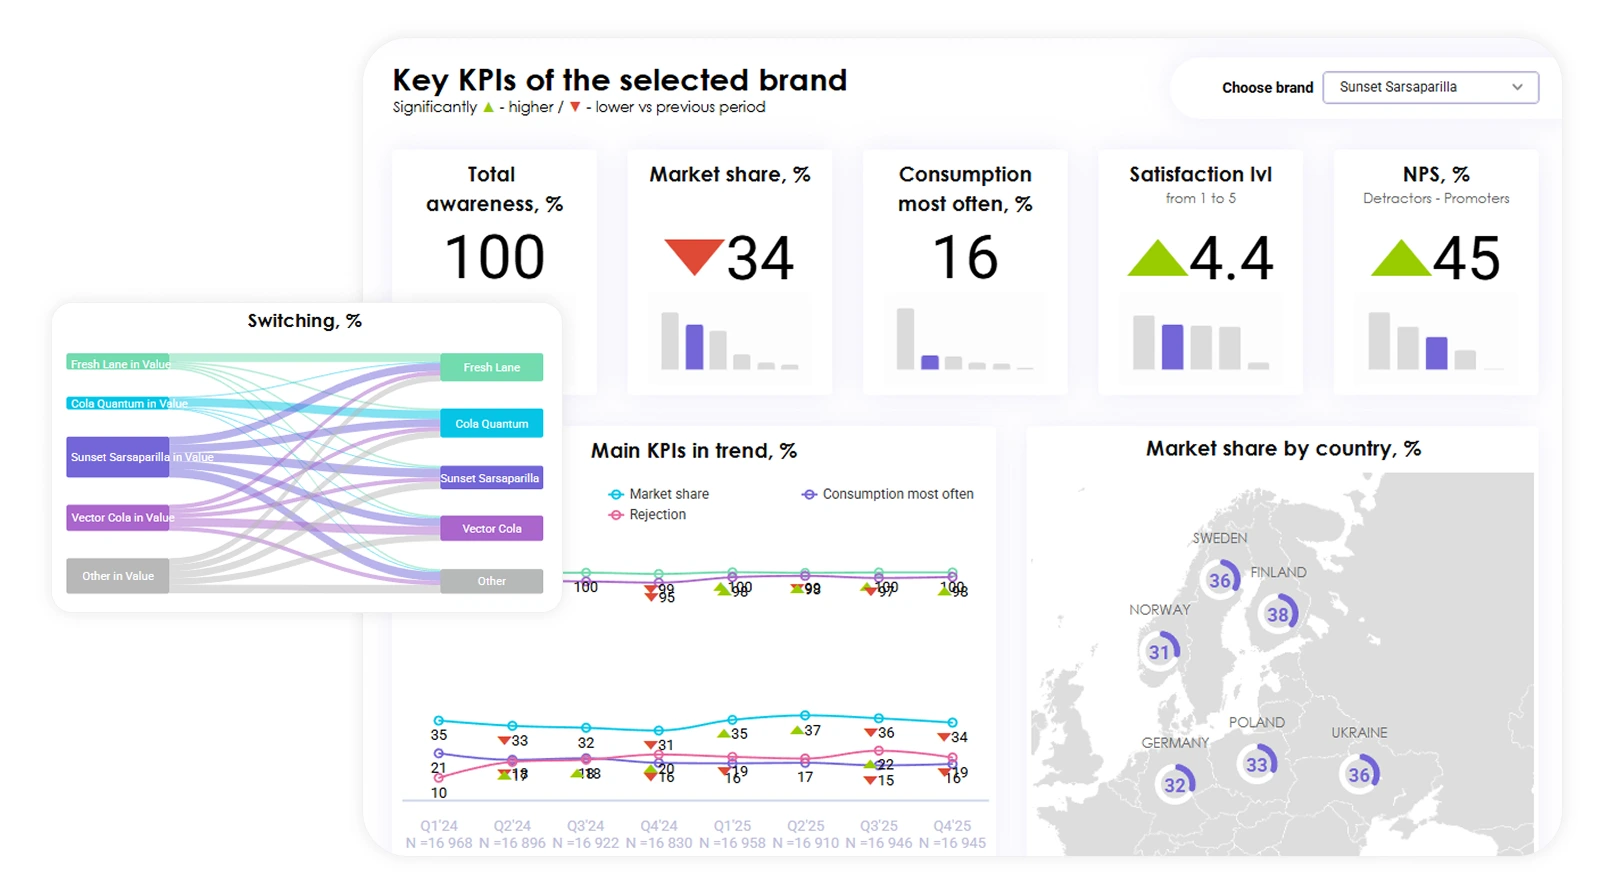
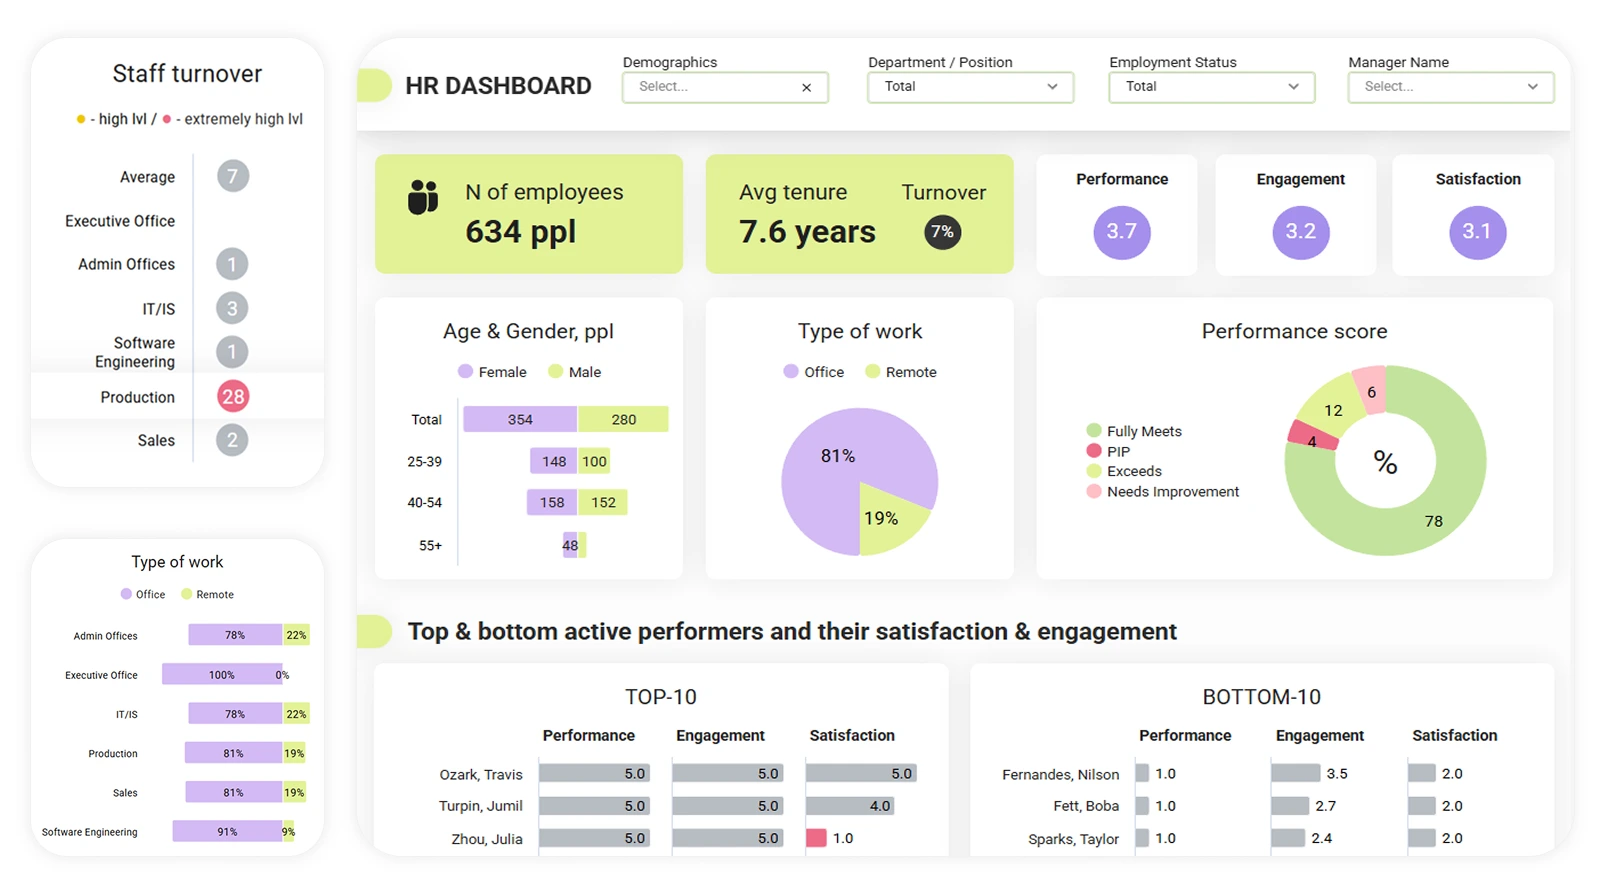
It also changes how you are perceived. Large agencies often have data teams, design teams, dashboard specialists, and production support. Independent consultants usually do not. But clients still compare the experience they receive. A polished, interactive, branded dashboard helps close that gap — not by pretending you are a large agency, but by giving clients the kind of clarity and access they expect from one, while you stay lean.
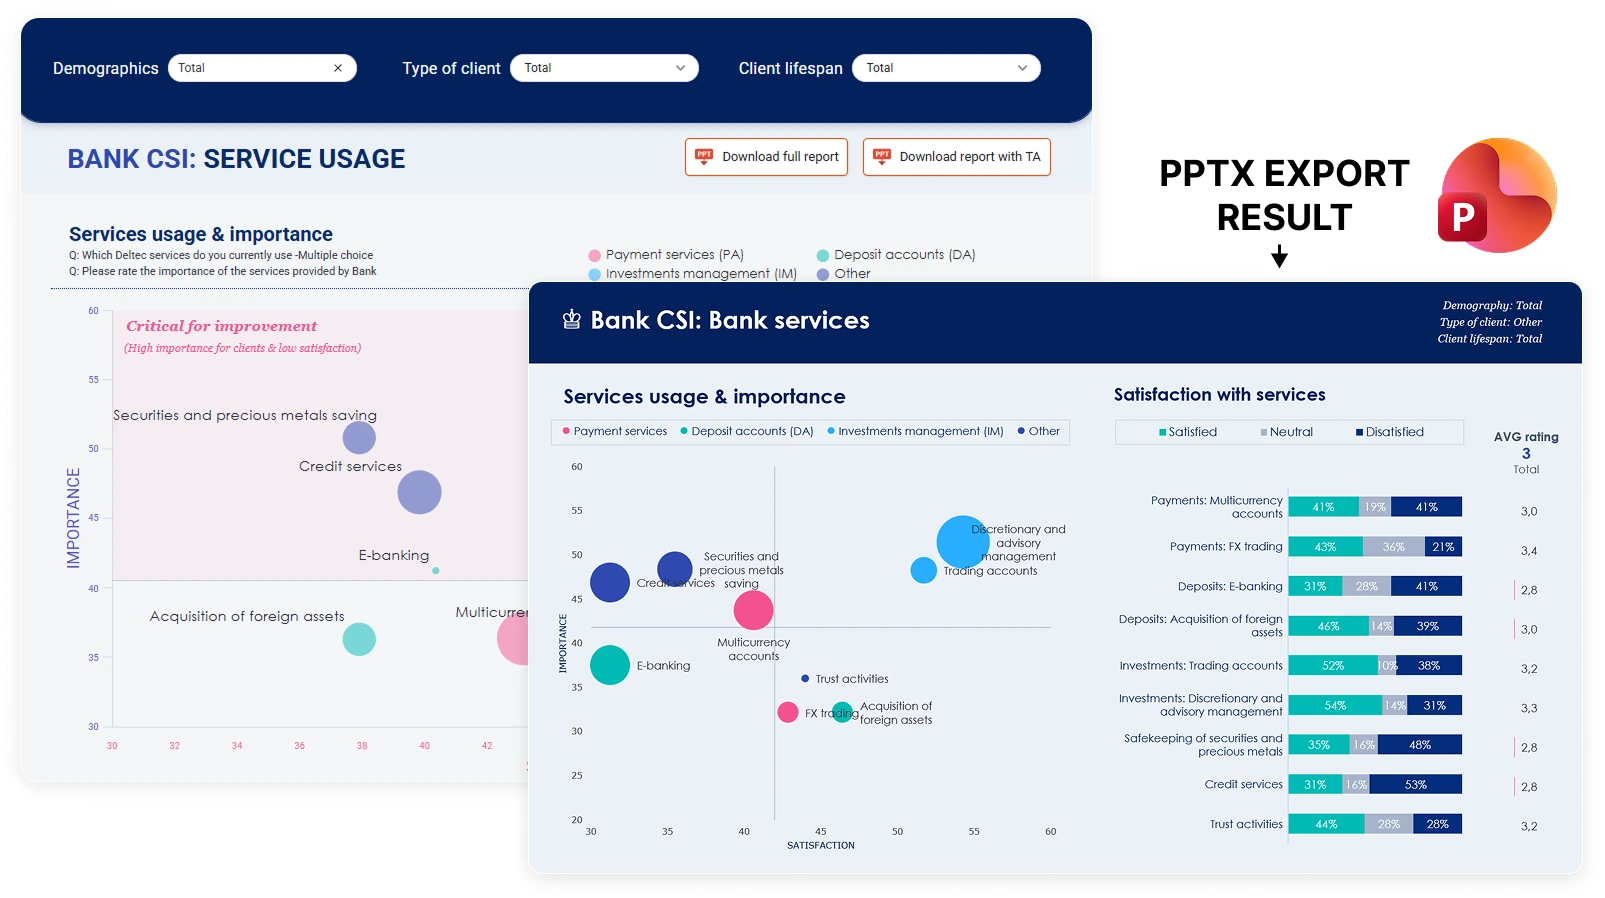
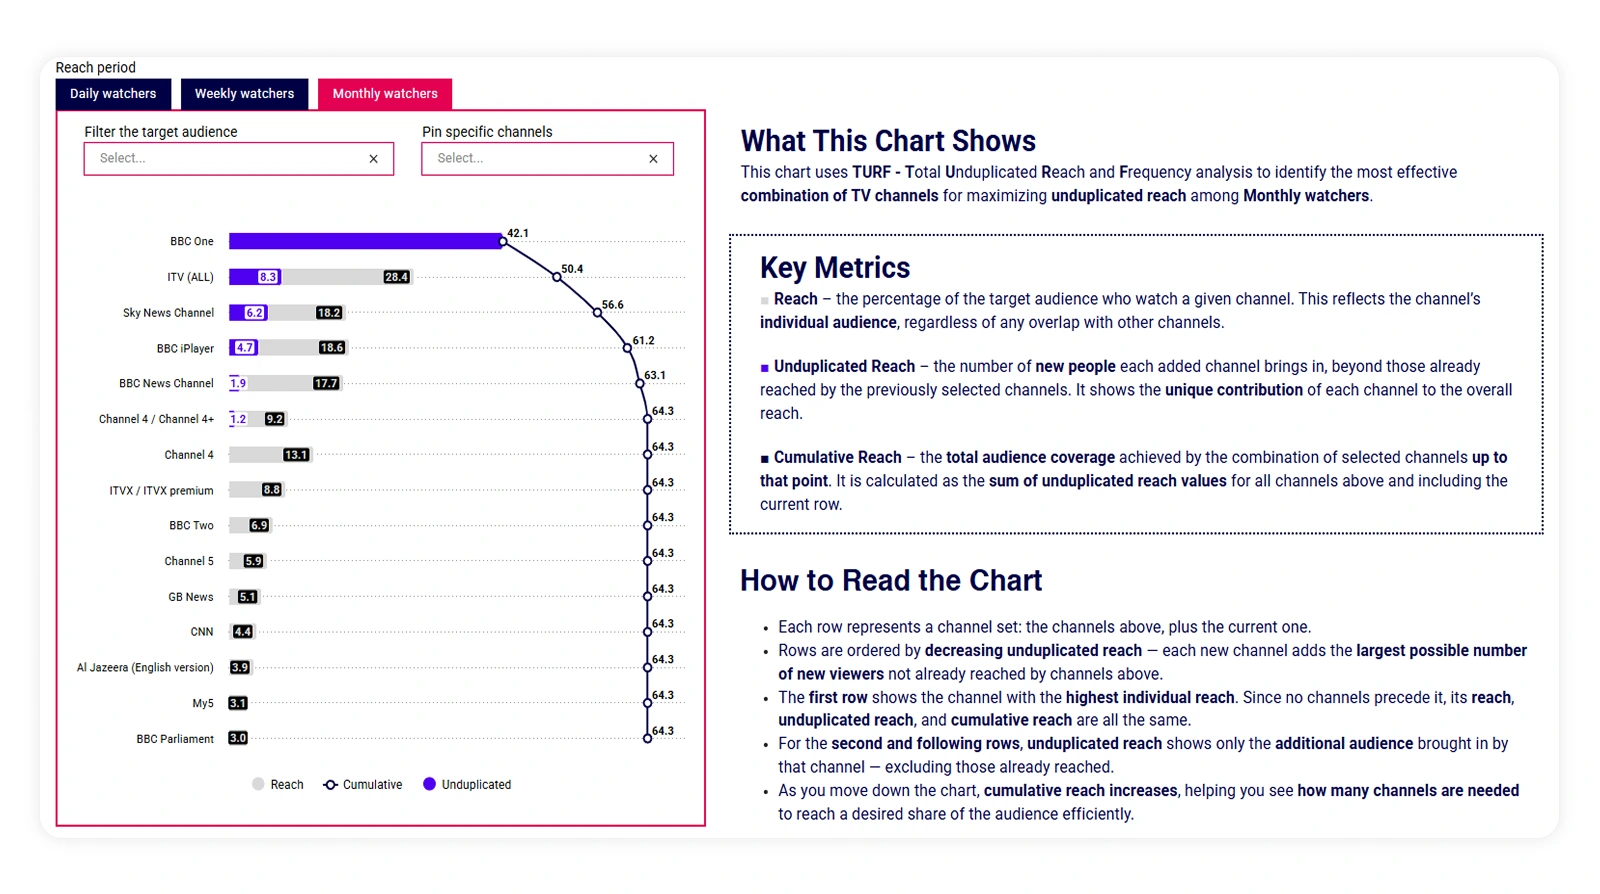
Dashboards also extend the life of a project. A research manager can share findings internally without sending around multiple PowerPoint versions. A marketing team can return to brand or customer data when planning campaigns. A leadership team can check key metrics without asking you to create another cut.
That does not replace your strategic thinking. It creates more reasons for clients to stay connected to it.
Where DataTile fits
The goal is not to remove the consultant from the process. It is to remove the repetitive heavy lifting that gets in the way of higher-value work.
Who should attend
This session is especially relevant if you are an independent consultant who works with survey data, customer insight, brand tracking, segmentation, product research, or any project where clients regularly ask for additional cuts of the data.
It will also be useful if you want to:
reduce time spent on manual reporting and slide revisions
give clients a more interactive, modern experience without building a larger team
understand when a dashboard genuinely replaces a slide deck and when it does not
hear directly from a peer consultant about what changed in practice — not just in theory
Join us for "Beyond the Slide Deck: Why Dashboards are the Secret Weapon for Independent Consultants"
If your consultancy time is still being eaten by slide updates, crosstabs, chart tweaks, and last-minute client requests, this session is worth 30 minutes of your time.
Svetlana Dosumova will present at the ICG Pitch Perfect session