All articles
Join DataTile’s Lightning Demo
In the live demo, Alex and Sumran will show how survey data can move from upload to crosstab analysis, charting and dashboard-ready outputs in minutes.
If your team still spends too much time moving between SPSS, Excel, PowerPoint and dashboarding tools, this session will show what a more connected workflow can look like.
Register here
Speakers
Alex is the Founder of DataTile with 20 years of hands-on experience in software development, data analysis, and integration.
Sum brings over 20 years of experience across research, strategy, and commercial product roles as the Commercial Strategy Director.

The problem: survey data is not the issue. The workflow often is.
Most insight teams are not short of data. They have brand trackers, customer satisfaction studies, concept tests, campaign research, product research, multi-market studies and recurring survey programmes. The challenge is what happens after the data is collected.
For many teams, the workflow still looks familiar:
export the data;
clean and label it;
run analysis and crosstabs;
create charts;
copy results into PowerPoint;
build or update dashboards separately;
check that the numbers match;
repeat the process when a new wave arrives.
Each step may be manageable on its own. But together, the process can become slow, fragmented and difficult to scale.
A stakeholder asks for one more cut of the data.
A client wants the latest wave added to the deck.
A chart needs to be replaced.
A number in a presentation needs to be checked and traced back to the source.
A dashboard and PowerPoint slide need to tell the same story.
This is where a lot of time disappears. Not because researchers do not know what they are doing. But because survey reporting often depends on too many manual steps between the dataset and the final output.
Why traditional tools are useful — but not always enough
SPSS, Excel, PowerPoint and BI dashboards all have a place in the research workflow.
SPSS and statistical tools are familiar for analysis. Excel is flexible. PowerPoint is still the format many stakeholders and clients expect. BI tools can be powerful for broader business reporting.
But survey data has its own logic.
It is not just a table of business metrics. It comes with variables, labels, crosstabs, banners, waves, segments, markets, respondent groups and recurring study structures. That makes survey reporting different from standard dashboarding.
A generic BI tool may help visualise data, but insight teams often need more than a dashboard layer. They need the analysis logic before the chart: clean labels, reliable crosstabs, repeatable outputs, wave-on-wave comparisons and the ability to move from analysis to presentation without rebuilding everything manually.
This becomes especially important for recurring studies.
One report can be handled manually. One tracker wave can be managed with enough time. But when the same study repeats across waves, markets, segments or clients, the manual work starts to become the bottleneck. Even small changes can add complexity — a new question is introduced, wording is updated, a segment definition changes or an additional market is added. What looks like the same study on the surface often requires another round of checking, updating and rebuilding before the outputs are ready.
What DataTile changes
DataTile is a research intelligence and analytics platform built specifically for analysing, visualising and reporting survey data.
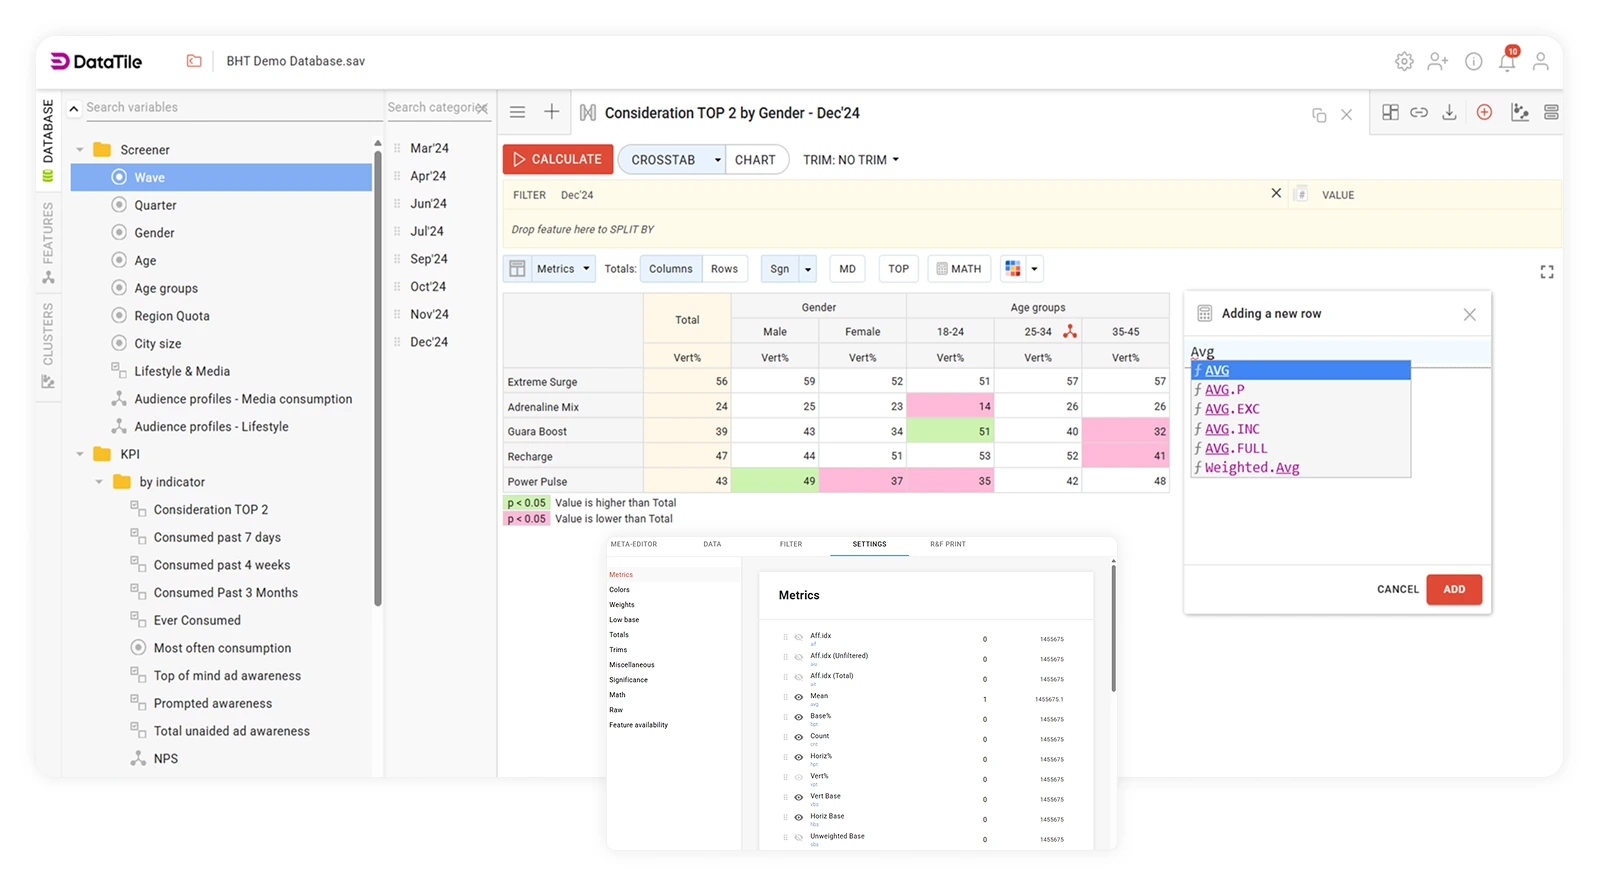
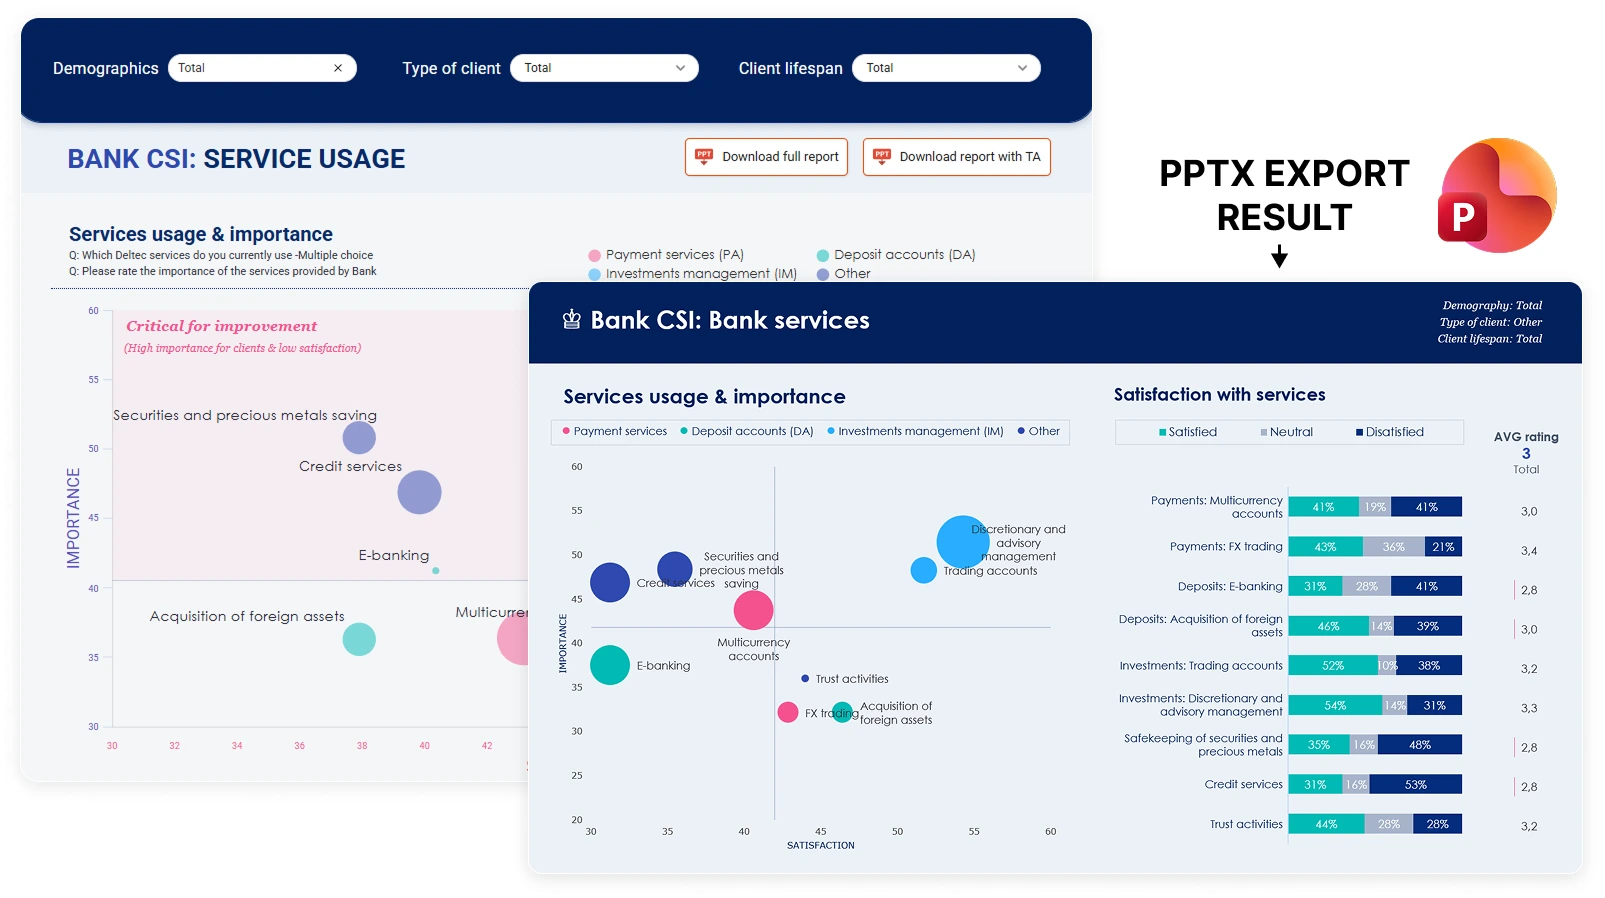
It brings the workflow into one secure environment — from data upload and labelling to crosstabs, charting, dashboards and PowerPoint-ready outputs.
The goal is not just to make dashboards look better.
The goal is to make the whole path from survey data to stakeholder-ready output faster, more consistent and easier to trust.
With DataTile, teams can:
upload and structure survey data quickly;
run crosstab analysis without rebuilding everything manually;
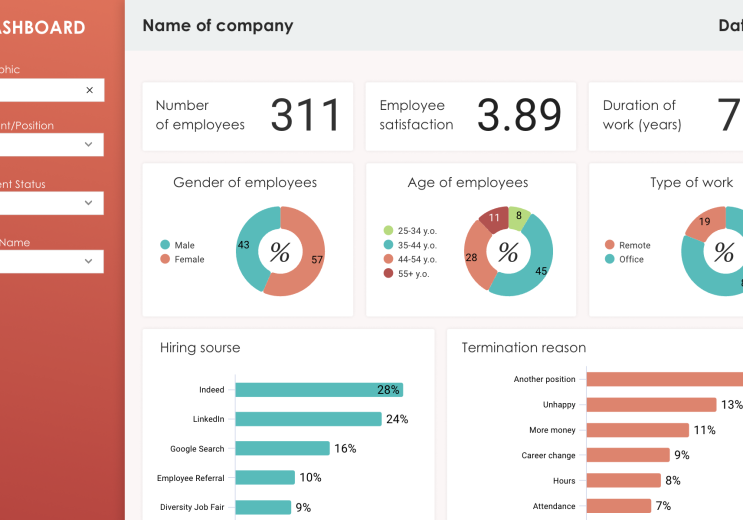
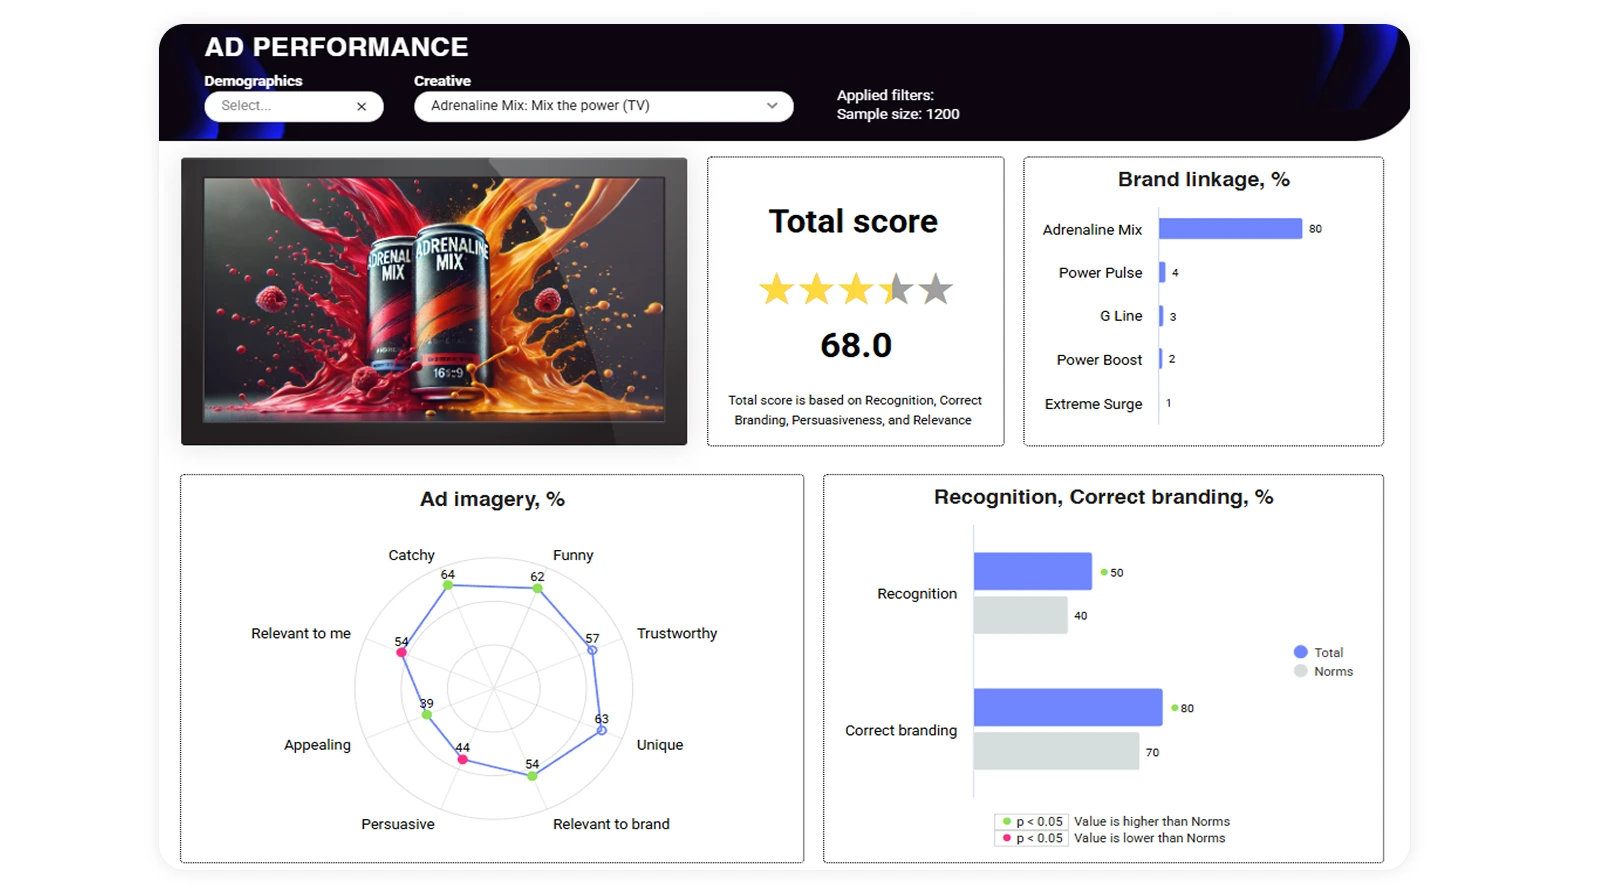
create charts and dashboards from the same source;
prepare outputs for PowerPoint more efficiently;
update or replace charts without having to rebuild the whole presentation;
trace where a specific number in a presentation came from;
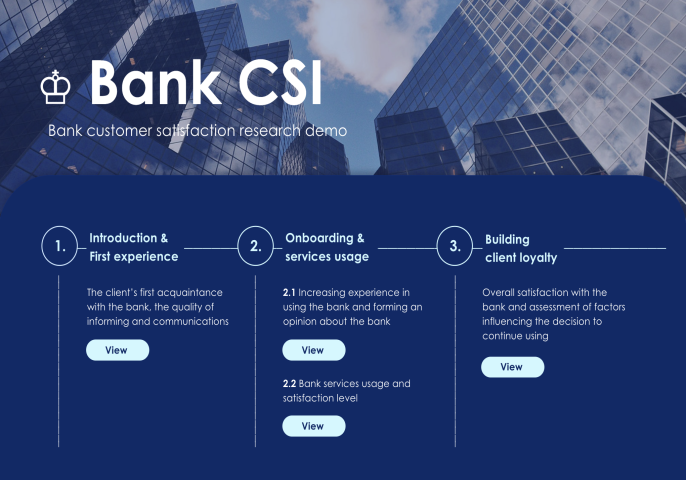
give stakeholders access to interactive dashboards so they can explore the data themselves.
That last point matters.
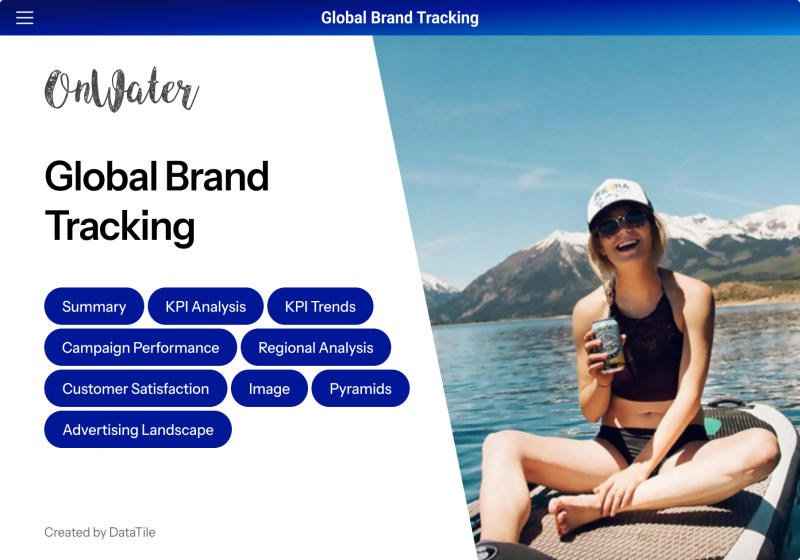
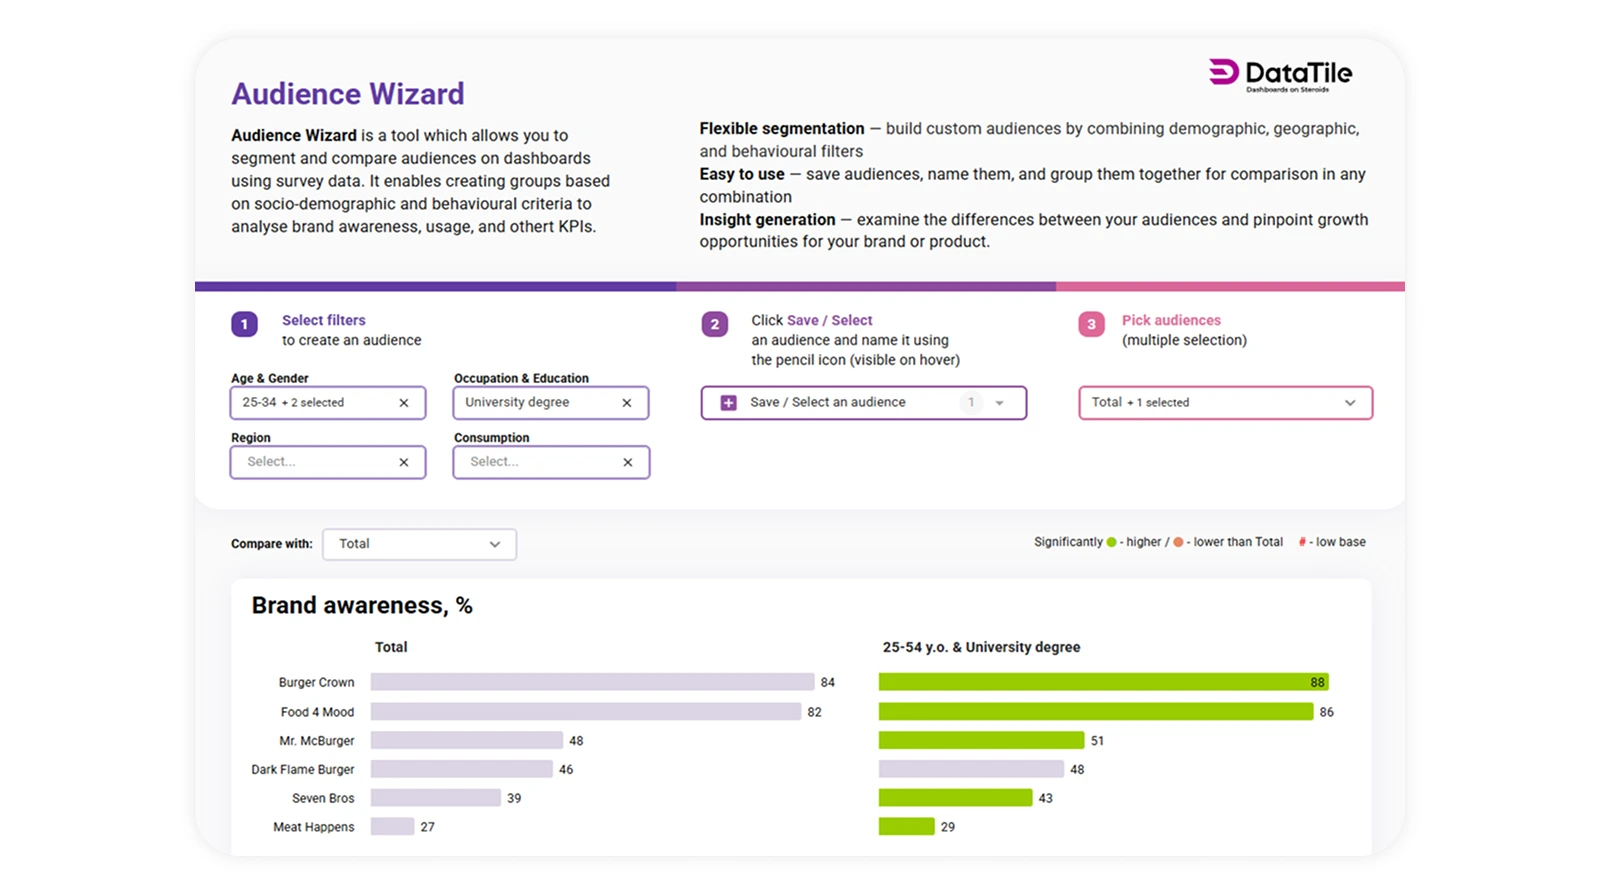
Not every stakeholder needs another static report. Sometimes the best output is a dashboard they can explore directly: by market, wave, segment, audience or brand. This helps insight teams move from being the only route to the data to becoming the team that enables better self-serve access to it.
Importantly, greater access does not have to mean less control. DataTile is built with enterprise-grade security in mind, supporting secure data management, role-based permissions and multi-level access controls. Teams can decide exactly who can view, explore or manage different datasets and outputs, helping organisations share insights more widely while staying aligned with internal governance requirements and security protocols.

Why this matters for in-house teams and agencies
DataTile is relevant for both in-house insight teams and research agencies, but the value is slightly different for each group.
For in-house insight teams | For research agencies |
Give marketing, brand and leadership teams faster access to tracker data | Deliver better client outputs without increasing analyst hours |
Make recurring survey data easier to explore by wave, market, segment or audience | Build repeatable reporting workflows for recurring studies |
Reduce dependency on static decks and one-off manual requests | Reduce margin lost to manual reporting, revisions and bespoke dashboard builds |
Improve confidence in the numbers by making outputs easier to trace back to the source | Replace repetitive deck updates with cleaner, more scalable reporting processes |
Support self-serve access for stakeholders through interactive dashboards | Create stronger client-facing deliverables and potential new revenue streams |
For in-house teams, the question is often:
How do we help more people across the business use research data confidently, without every question becoming another manual request for the insight team?
For agencies, the question is often:
How do we deliver more polished, more useful client outputs faster, without adding more pressure to the team or increasing costs?
Both questions point to the same need: a better workflow between survey data, analysis, dashboards and presentations.
Where DataTile is especially useful
DataTile is particularly relevant for teams working with large, regular or complex survey datasets, including:
brand trackers;
multi-market studies;
customer satisfaction and NPS programmes;
campaign and marketing effectiveness research;
product and concept testing;
recurring client reporting;
internal stakeholder dashboards;
proprietary datasets and client-facing reporting products.
These are the types of projects where manual reporting becomes expensive.
A new wave arrives.
A client asks for an extra split.
A market needs to be added.
A chart needs to change.
A number needs to be verified.
A presentation needs to be updated without breaking the rest of the story.
DataTile is built to make this kind of work faster and more repeatable.
What you’ll see in the Lightning Demo
In the 10-minute session, DataTile will show a live workflow from survey data to stakeholder-ready outputs.
The demo will cover:
data upload;
crosstab analysis;
chart creation;
dashboard building;
examples of how DataTile supports brand trackers, multi-market studies and recurring research;
how in-house teams and agencies use DataTile to improve reporting and stakeholder access.
The session will also show why DataTile is useful not only for creating outputs faster, but for making those outputs easier to update, easier to reuse and easier to trust.
Join the demo
You’ll see how DataTile helps research teams move from survey data to crosstabs, charts, dashboards and PowerPoint-ready outputs — faster, with less manual work and with a clearer link between the numbers and the source data.
Register here