


Bank CSI: Customer Satisfaction Research Dashboard
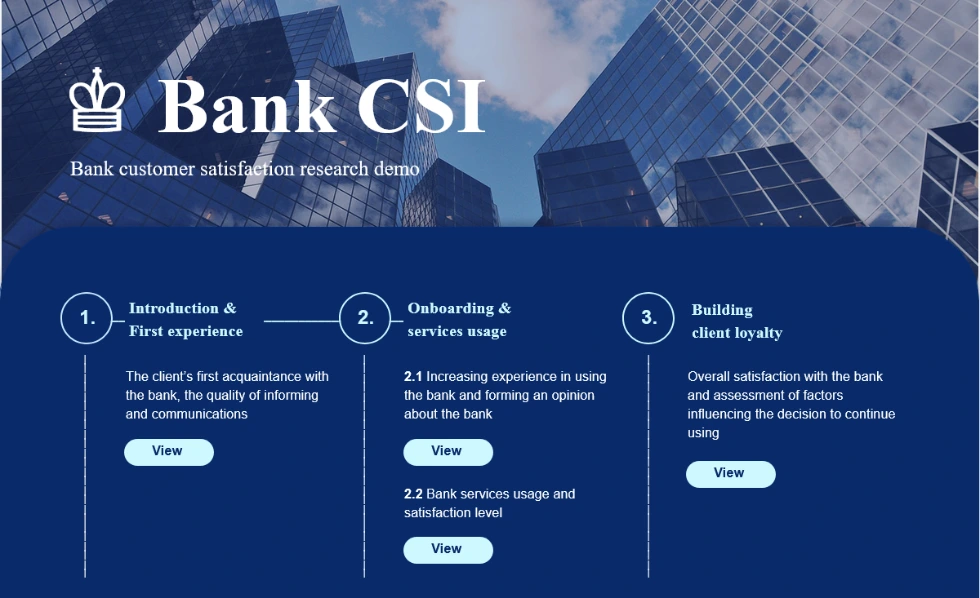
This Bank CSI demo shows how customer satisfaction research can be explored in DataTile across the banking client journey, from first impressions and onboarding to service usage and client loyalty.
What you can explore
✽ Customer Satisfaction Index
What this dashboard shows
The Bank CSI example follows different stages of the client relationship and combines overall satisfaction with more detailed feedback on communication, services and loyalty.
First client experience
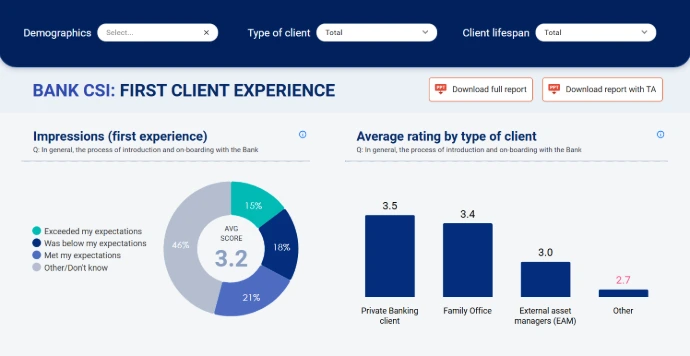
See how clients rate their first interaction with the bank, including the introduction and onboarding process, and compare average ratings between different client types.
Onboarding and communication
The onboarding view looks at communication quality, accessibility, bank image, technology and the information clients receive.
Service usage and satisfaction
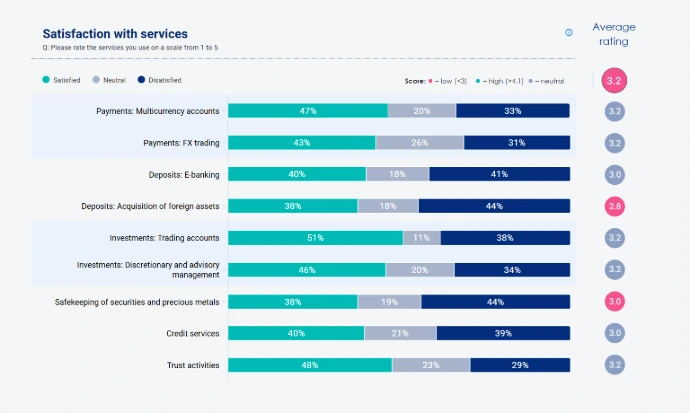
Individual banking services can be compared by usage, importance and satisfaction, making it easier to spot areas where high client importance is paired with weaker satisfaction.
Satisfaction and loyalty
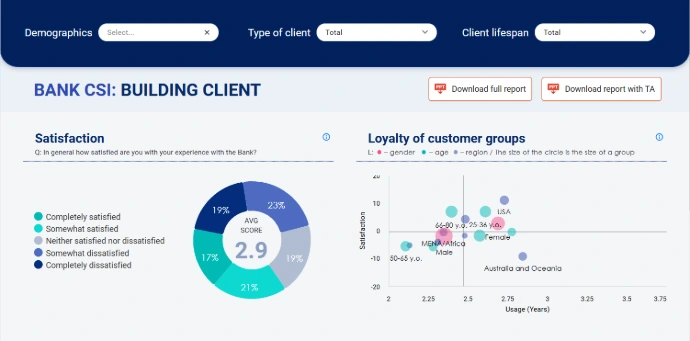
Overall satisfaction is shown alongside different customer groups, allowing results to be compared by relationship length and other segments.
What may keep clients and what may make them leave
The dashboard also shows what clients say may influence them to make a bank their main provider — and what may lead them to leave or stop using its services.
A closer look at the dashboard
Understand the first stages of the client relationship
See where satisfaction and importance meet
Compare individual banking services by usage, importance and satisfaction, and identify areas where high client importance is paired with weaker satisfaction.
Explore satisfaction, loyalty and retention factors
Working with customer satisfaction survey data?
See how DataTile supports NPS and customer satisfaction analysis and reporting, from headline measures to detailed audience and service-level views.

Browse more examples in the Dashboard Gallery
See other ways research data can be analysed, visualised and shared in DataTile

Try DataTile for free
Isn’t it time you transformed your business? Try DataTile for free and see how it can enhance your productivity with it’s thorough analysis, interactivity and speed.