


Brand Health Tracking Dashboard: Burger Brand Example
What changed since the last survey wave, and are competitors seeing the same shift? This interactive DataTile dashboard shows how researchers can benchmark brand KPIs, follow trends across survey waves and explore results for different audiences.
All brands, data and visual elements are simulated for demonstration purposes.
What brand health tracking helps teams decide
A brand tracker helps research and insights teams answer questions like these:
Where does our brand lead or lag competitors on awareness, consideration and usage?
Which audience groups changed most since the previous wave?
What puts people off our brand, and which alternatives do they consider?
Which attributes matter most to consumers, and how does our brand score on them?
What this dashboard shows
This DataTile dashboard brings together competitor benchmarks, KPI trends, NPS, brand image and audience profiles from a single brand tracker.
Brand benchmarks and funnels
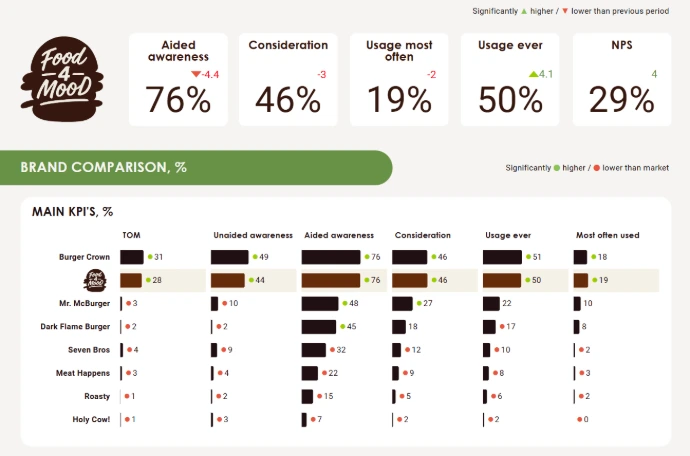
The Brand Comparison table puts top-of-mind, unaided and aided awareness alongside consideration and usage for eight brands.
Separate Awareness Funnel and Usage Funnel charts show the levels within each set of measures.
KPI trends and statistical significance
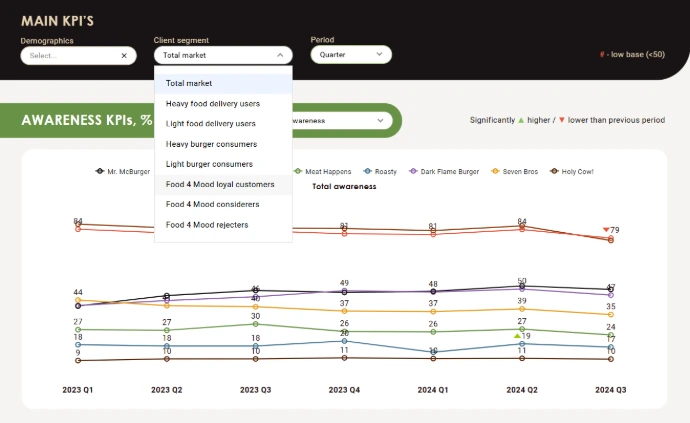
Follow awareness and usage across survey waves. On the trend charts, arrows flag statistically significant changes from the previous period.
In the comparison tables, coloured markers flag significant differences against the benchmark shown on that screen.
NPS and the Loyalty Ladder
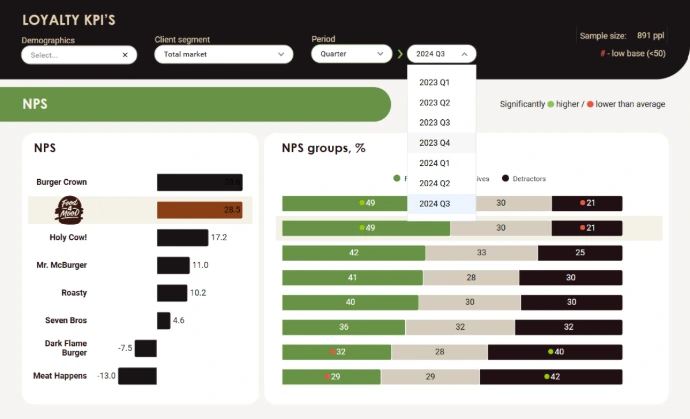
The Net Promoter Score (NPS) view shows each brand’s score alongside its mix of promoters, passives and detractors.
The Loyalty Ladder puts four measures side by side: awareness, consideration, ever used and regular use. Both have trend views.
Consideration barriers and cross-usage
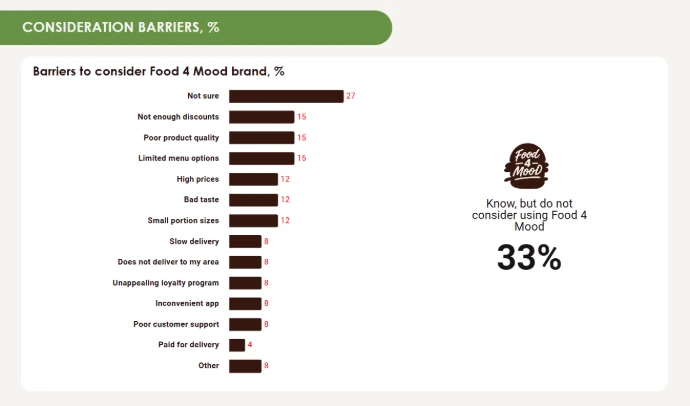
Switching and Cross-Usage shows which alternatives people who rule out Food 4 Mood consider, and which brand recent Food 4 Mood users say they use most often.
Brand image and associations
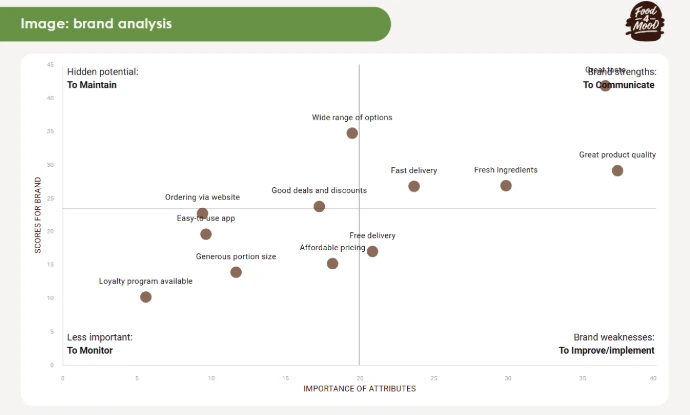
Brand Associations highlights which associations are more specific to the selected brand. A separate map plots attribute importance against Food 4 Mood’s scores.
Audience profiles and delivery habits
Burger User Portrait covers demographics and household characteristics. Filters include age, household income and groups such as frequent delivery users and loyal Food 4 Mood customers.
Why use an interactive dashboard?
A week after the quarterly presentation, someone on the brand team wants to know whether the latest drop in aided awareness also appeared among frequent delivery users.
In DataTile, they can reopen the tracker, select that audience and pull up the same measure across survey waves.
Researchers can share the dashboard alongside the quarterly report so clients and colleagues can answer follow-up questions between presentations.
Book a demo
A closer look at the dashboard
Where does Food 4 Mood stand against competitors?
Which changes stand out across survey waves?
On the Main KPI's Trends screen, choose an awareness or usage measure. Each line follows a brand through the same survey waves. An arrow marks a statistically significant change from the previous period.
What puts people off Food 4 Mood?
Which brand attributes are worth a closer look?
On the Brand Image map, the horizontal axis shows how important each attribute is, and the vertical axis shows how Food 4 Mood scores on it. The lower-right quadrant highlights attributes that matter to consumers and score relatively low for the brand.
What’s behind each brand’s NPS?
Working with Brand Health Tracking data?
See how DataTile supports recurring Brand Health Tracking across brands, markets and waves, from ongoing analysis to reporting.
Solutions for Brand Health Tracking
Looking for a deeper category-level example?
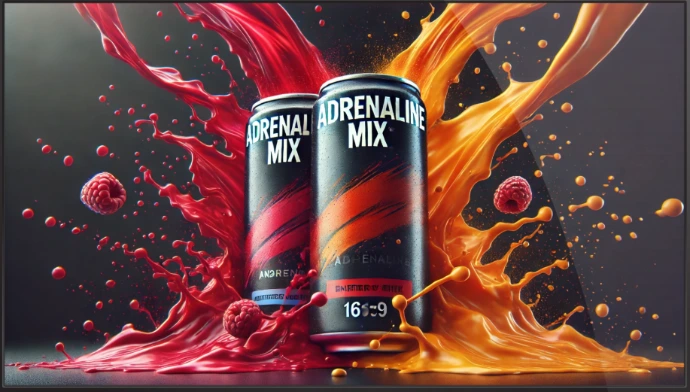
The Energy Drinks example goes deeper into a single category, with brand KPIs, advertising effectiveness, imagery, switching, loyalty and audience profiling.
Or browse more examples in the Dashboard Gallery
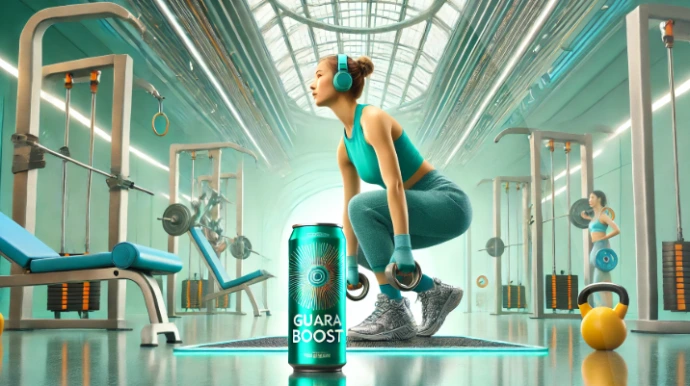
TURF Analysis, HR Dashboard, Social Media Listening, Purchase Progress, Renewable Energy, Ocean Clean-up, Bank CSI/NPS, TV Audience, Freedom of the Net

Discuss your brand tracking study with our experts
Already running a brand tracker? Tell us what you measure each wave, which brands and audiences you compare, and what your team or clients ask about most. We can talk through how to set up your tracker in DataTile