


HR & Workforce Analytics Dashboard
See how workforce data can be analysed in DataTile, from company-level HR KPIs and hiring trends to department comparisons and individual employee views.
What you can explore
The different views let users move from company-level metrics to department and individual employee views.
✽ HR & Workforce Analytics Dashboard
What this dashboard shows
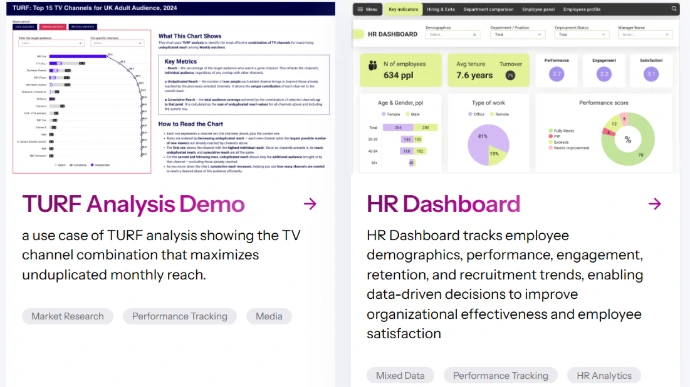
This example combines workforce metrics with performance, engagement and satisfaction data in one interactive HR dashboard.
Key workforce indicators
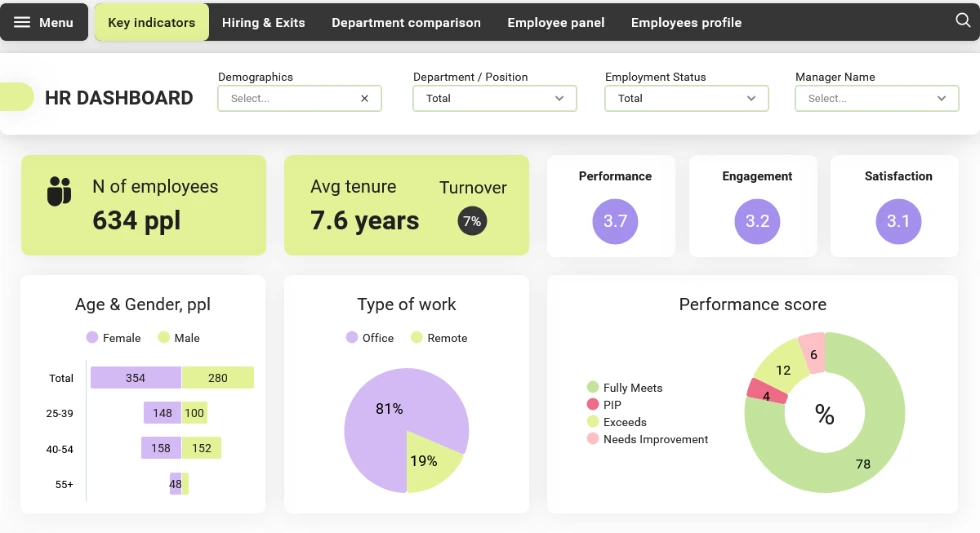
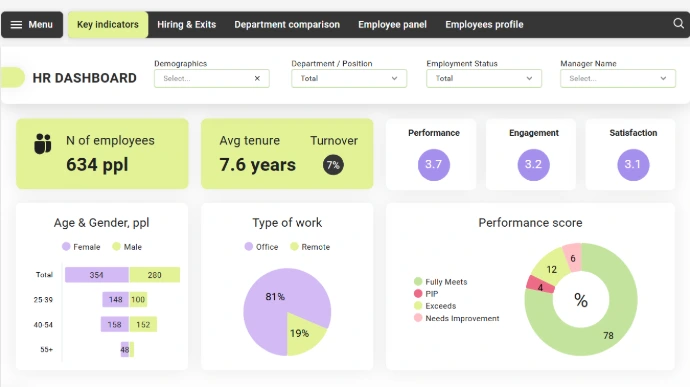
The overview combines headcount, average tenure and turnover with performance, engagement and satisfaction. It also shows workforce demographics, office and remote working patterns, and performance-score distribution.
Employee-level views
Department comparison
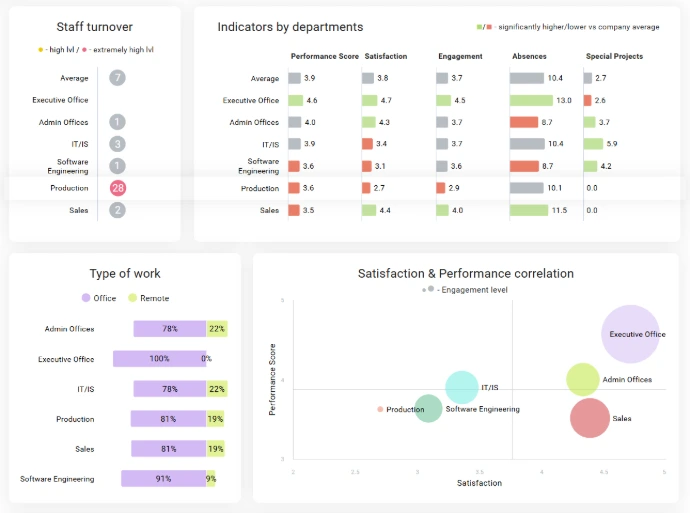
Department-level views show differences in performance, satisfaction, engagement, absences and other workforce indicators. They also compare turnover, working patterns, hiring sources and termination reasons across departments.
Workforce profile
The workforce profile breaks down employees by age, gender, marital status, location and citizenship, and also shows female leadership share.
Hiring and exits
A closer look at the dashboard
Start with the company-wide picture
Follow how the workforce changes over time
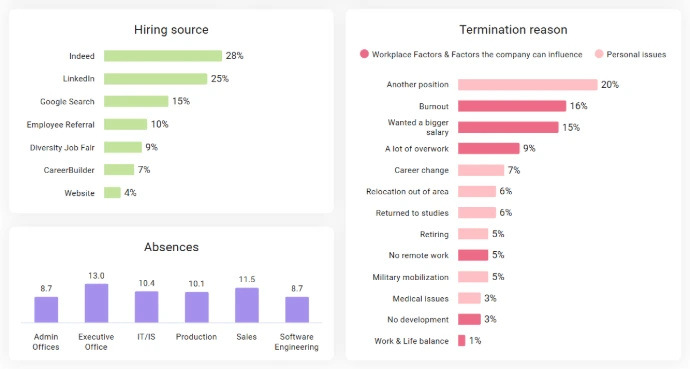
Compare hires and terminations, hiring sources, absence levels and recorded termination reasons.
Compare departments side by side
Working with Employee Experience or engagement survey data?
See how DataTile supports Employee Experience and engagement survey analysis and reporting across different employee groups and segments.
Employee Experience & Engagement Surveys

Explore more dashboard examples
See other ways research data can be analysed, visualised and shared in DataTile

Try DataTile for free
Isn’t it time you transformed your business? Try DataTile for free and see how it can enhance your productivity with it’s thorough analysis, interactivity and speed.