
 All articles
A brand health tracking dashboard should make three things clear:
Where the brand stands now.
What has changed over time.
Which markets, audiences or competitors are driving that change.
That sounds simple. In practice, many brand tracking dashboards become collections of charts that only the research team fully understands.
The data may be correct. The research may be solid. But the people who need to act on it cannot quickly work out what matters.
A useful dashboard does not show everything at once. It gives different users a clear starting point, enough context to interpret the results and a sensible route into the detail.
Here is how to build one.
What is a brand health tracking dashboard?
A brand health tracking dashboard is an interactive reporting tool used to monitor how a brand is perceived and how that perception changes over time.
It usually brings together metrics such as:
brand awareness;
familiarity;
consideration;
preference;
usage;
trust;
relevance;
brand associations;
satisfaction or advocacy.
The exact metrics depend on the category, research design and business questions.
A brand health dashboard may compare:
one wave with another;
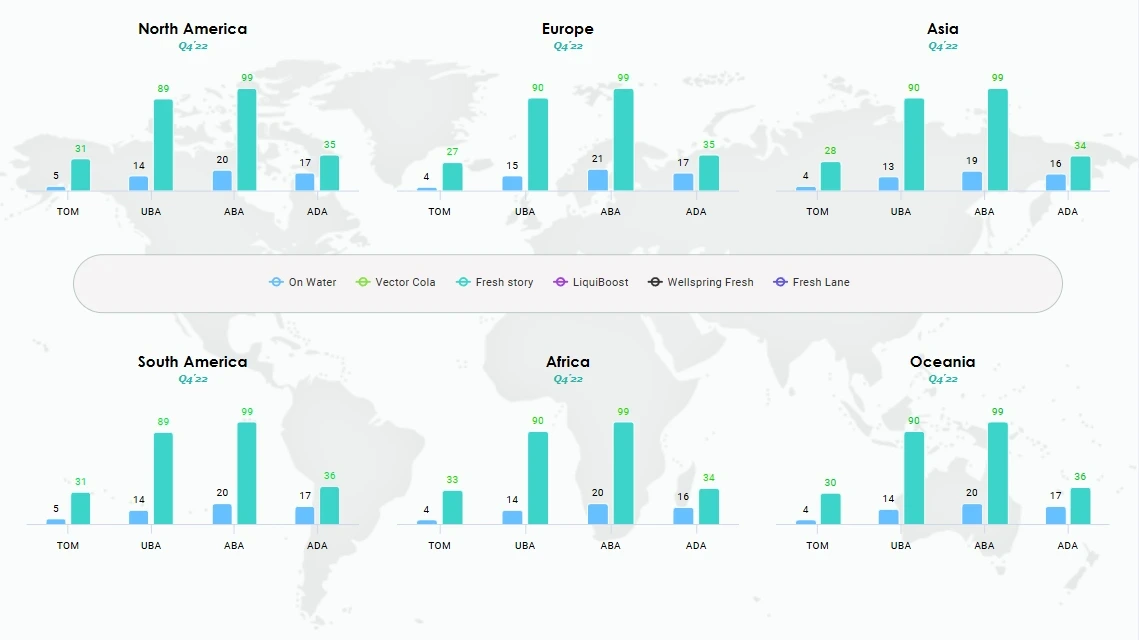
different markets or regions;
audience segments;
customers and non-customers;
the brand and its competitors;
campaign periods;
product or service lines.
The dashboard is not the research study itself. It is the layer through which people explore and use the results.
Start with the decisions, not the charts
A common mistake is to begin by listing every metric available in the survey and finding a chart for each one.
That usually produces a dashboard that is technically complete but difficult to use.
Start with the decisions the dashboard needs to support.
For example:
Has the brand become more or less visible?
Is consideration improving among a priority audience?
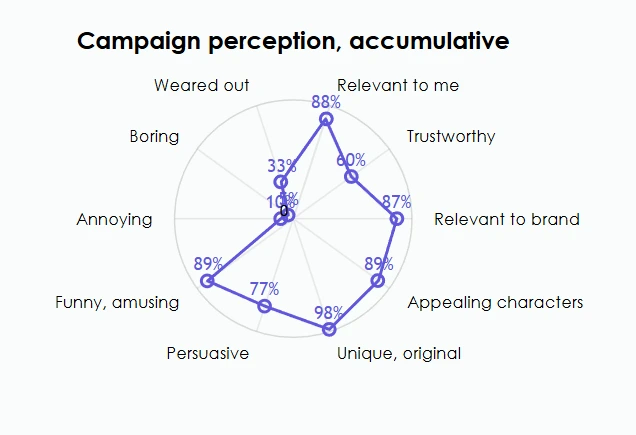
Are recent campaigns changing the way people describe the brand?
Is one competitor gaining ground?
Is performance improving in one market but declining in another?
Are awareness gains leading to trial or preference?
Which audience should the marketing team investigate more closely?
These questions should shape the dashboard structure.
A senior brand leader may need a quick view of the most important changes. An insight manager may need to examine the data by wave, market and audience. A local team may only need results for its own country.
Trying to serve all three users with the same opening screen rarely works.
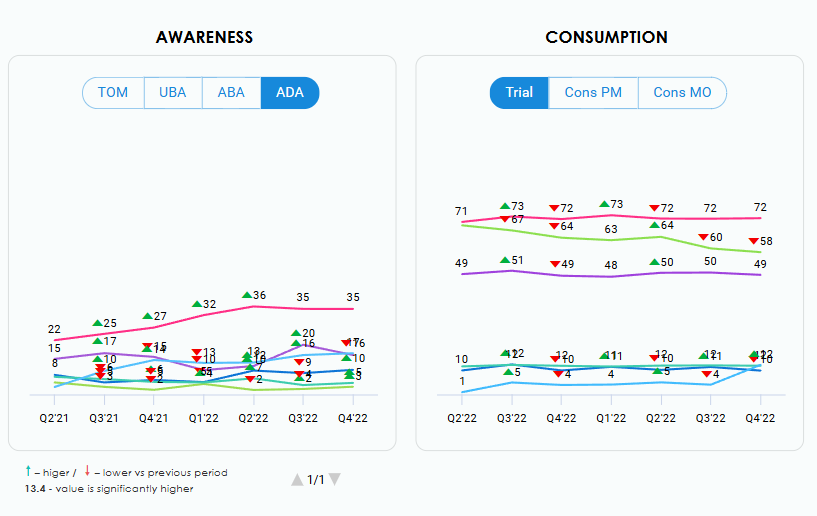
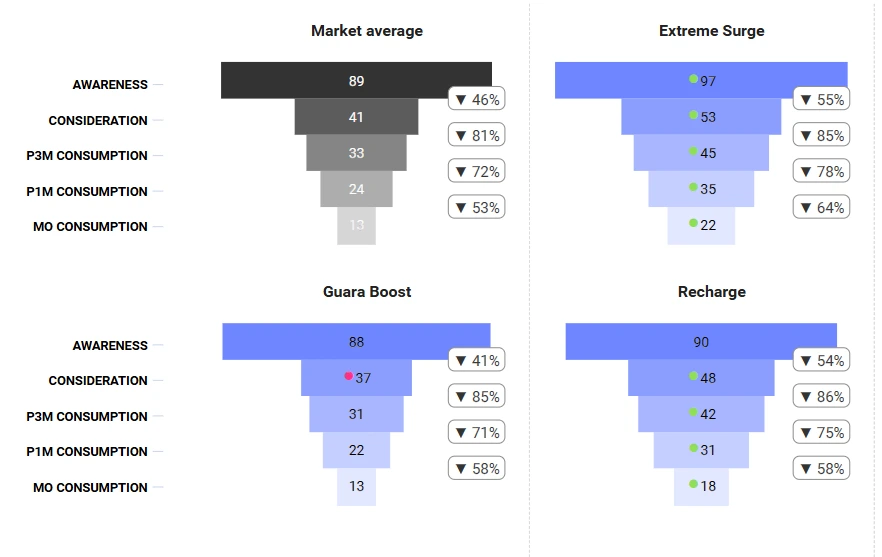
✽ Not every KPI deserves equal visual weight.
Build a clear hierarchy of brand health metrics
A good brand tracking dashboard usually has several levels.
Headline brand health metrics
These are the measures that senior stakeholders are most likely to check first.
They might include:
awareness;
consideration;
preference;
usage;
trust;
recommendation;
an overall brand health score, if the organisation uses one.
These measures belong on the opening page because they provide a quick view of current performance.
But the dashboard should not stop there. A headline score tells you that something changed. It does not necessarily tell you why.
Brand funnel metrics
The brand funnel shows how people move from knowing the brand to considering, choosing or using it.
A typical funnel might include:
unaided awareness;
aided awareness;
familiarity;
consideration;
trial;
current usage;
preference.
The exact stages will vary.
The important thing is to show the relationship between them.
For example, strong awareness combined with weak consideration suggests a different problem from strong consideration combined with low usage.
A row of unrelated percentages makes that relationship harder to see. A properly structured funnel helps stakeholders understand where momentum is being lost.
Brand image and association metrics
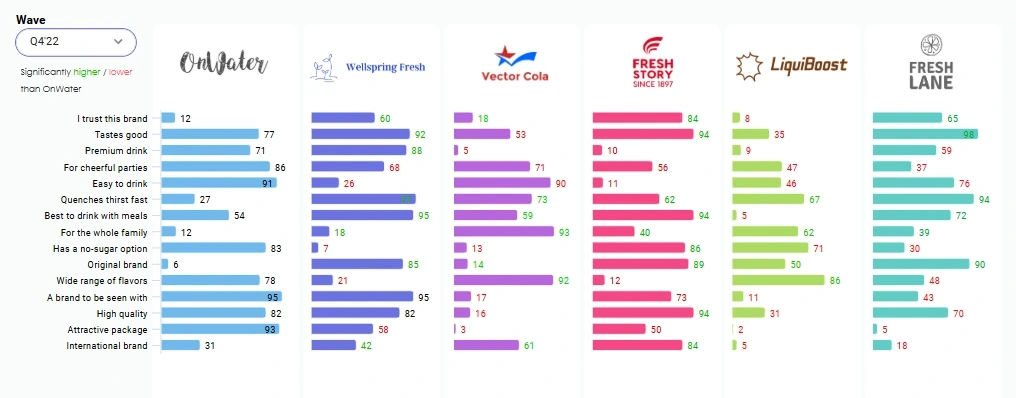
Brand health is not only about whether people know the brand. It is also about what they associate with it.
These measures may cover perceptions such as:
trustworthy;
innovative;
good value;
easy to use;
relevant to me;
high quality;
responsible;
different from competitors.
This part of the dashboard should help users answer:
Which associations are strongest?
Which have changed?
Where does the brand lead or trail competitors?
Which attributes matter most to the intended positioning?
Avoid putting every attribute on one crowded chart. Group related attributes, allow users to select them or separate strategic attributes from broader diagnostic measures.
Audience and market breakdowns
A total-market result may hide the most important part of the story.
A stable overall score could contain:
growth among younger consumers;
decline among existing customers;
strong performance in one region;
weak performance in another;
different reactions among high-value segments.
The dashboard should therefore allow relevant cuts of the data without forcing users to rebuild the analysis themselves.

130+ dashboards for 1000+ users across the globe
Try DataTile for free and see how it can enhance your productivity with it’s thorough analysis, interactivity and speed.
Use filters that answer real business questions
More filters do not automatically make a dashboard more useful.
- wave or time period;
- market or country;
- region;
- audience segment;
- customer status;
- age group;
- brand;
- product category;
- campaign exposure, where available.
For example, a global team may need country and region filters. A local brand team may care more about customer type, age and competitor set.
Default selections matter too. A dashboard should open with a sensible view, not a blank screen or an arbitrary set of filters.
Show change, not just the latest number
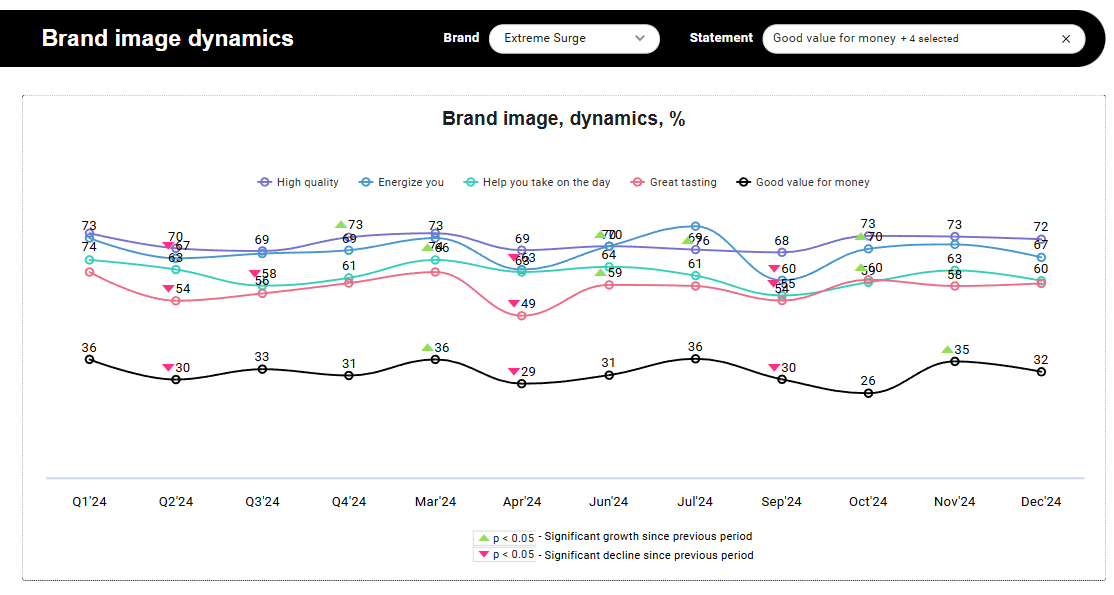
Brand tracking is valuable because it shows movement over time.
A brand health dashboard should therefore make trends easy to see.
For each important metric, users should be able to understand:
the current result;
the previous wave;
the longer-term trend;
the comparison with competitors;
the performance of relevant segments.
Where the study includes statistical significance testing, the dashboard should make meaningful changes distinguishable from normal variation. It should also make bases and sample sizes accessible where they are needed for interpretation.
A change from 41% to 43% may be important, or it may not. Without context, a stakeholder cannot tell.
Use trend charts where trends matter. Use scorecards where the current position matters. Use comparison charts where the competitive gap matters.
Do not use one chart type for every question.
Separate the executive view from the exploration view
A practical brand health tracking dashboard often works better with two layers.
The executive view
This page should answer:
How is the brand doing?
What changed?
Where should we pay attention?
It might contain:
a small number of headline KPIs;
movement since the previous wave;
a short competitive comparison;
one or two notable audience differences;
links into more detailed sections.
The goal is orientation, not exhaustive analysis.
The exploration view
This is where insight teams and other experienced users can investigate:
trends by wave;
detailed brand funnels;
individual associations;
market differences;
audience segments;
competitor results;
supporting tables or crosstabs.
The two layers can use the same underlying data while serving different needs.
This is usually more effective than either extreme: a static executive summary with no detail, or a fully open analysis tool with no guidance.
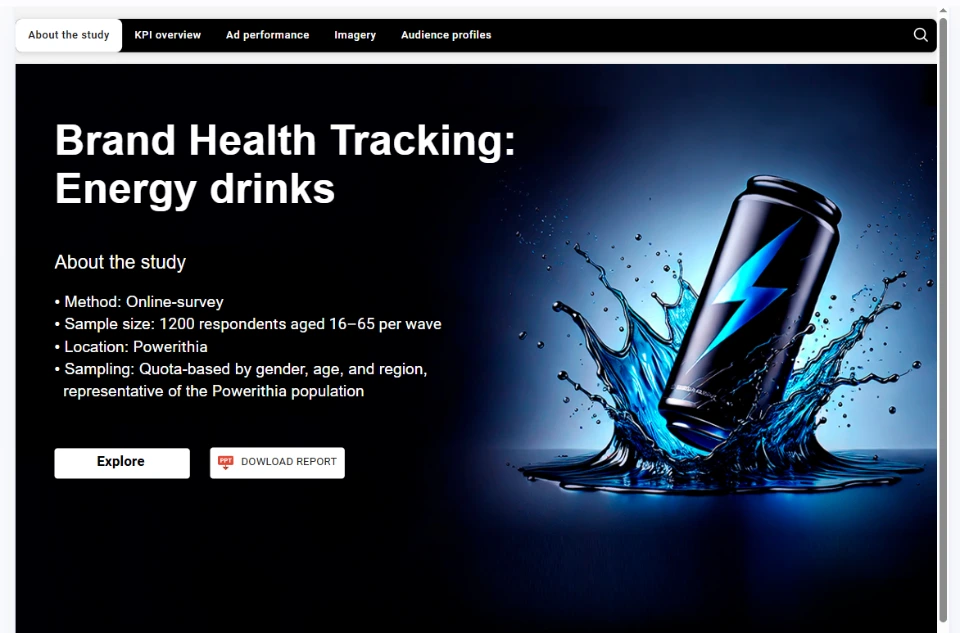
Energy Drink
Brand Health Tracking Dashboard
Click on the image to open the page with the dashboard
A practical dashboard structure
There is no universal template, but the following structure works well for many brand health tracking studies.
Page 1: Brand health overview
Include:
headline KPIs;
change from the previous wave;
trend direction;
main competitor comparison;
key areas to investigate.
This should be the quickest page to understand.
Page 2: Brand funnel
Show:
awareness;
familiarity;
consideration;
trial or usage;
preference.
Allow comparison across time, competitors and priority segments.
Page 3: Brand image and associations
Show:
strongest associations;
movement over time;
competitive strengths and weaknesses;
differences by audience.
Group attributes logically instead of presenting one long list.
Page 4: Audience analysis
Allow users to compare:
strategic segments;
customers and non-customers;
demographic groups;
regions or markets.
Keep the most commercially relevant audiences prominent.
Page 5: Competitive position
Show:
the brand’s position against selected competitors;
areas of relative strength;
areas where competitors are gaining;
changes in the category landscape.
Avoid comparing every brand with every other brand on every metric.
Page 6: Detailed results
Provide access to:
supporting measures;
detailed cuts;
crosstabs;
bases;
methodological notes.
This information matters, but it does not need to dominate the opening pages.

"... Agility is key for us. Being able to collect and analyse consumer feedback ensures that we always have our finger on the pulse and DataTile helps us do this. We can now analyse and present our data with speed and ease, often within hours of fieldwork closing..."

Common mistakes to avoid
Check your dashboard
Showing too many KPIs at once
Treating every user as an analyst
Most stakeholders do not want to explore every possible combination of filters.
They want to understand what changed and then investigate the relevant detail.
Making every chart visually important
If everything is highlighted, nothing is highlighted.
Using charts without context
A number needs comparison.
Depending on the question, useful context might be:
the previous wave;
the same period last year;
a target;
a competitor;
the category average;
a priority segment.
Mixing unrelated questions on one page
Awareness, brand imagery, customer satisfaction and market segmentation may all belong in the same study.
That does not mean they belong on the same screen.
Ignoring the update process
Before building it, decide:
how new data will be added;
which labels and variables must stay consistent;
how markets and waves will be compared;
who owns the updates;
how changes to the questionnaire will be handled.
A recurring tracker needs a repeatable reporting structure, not a one-off design.
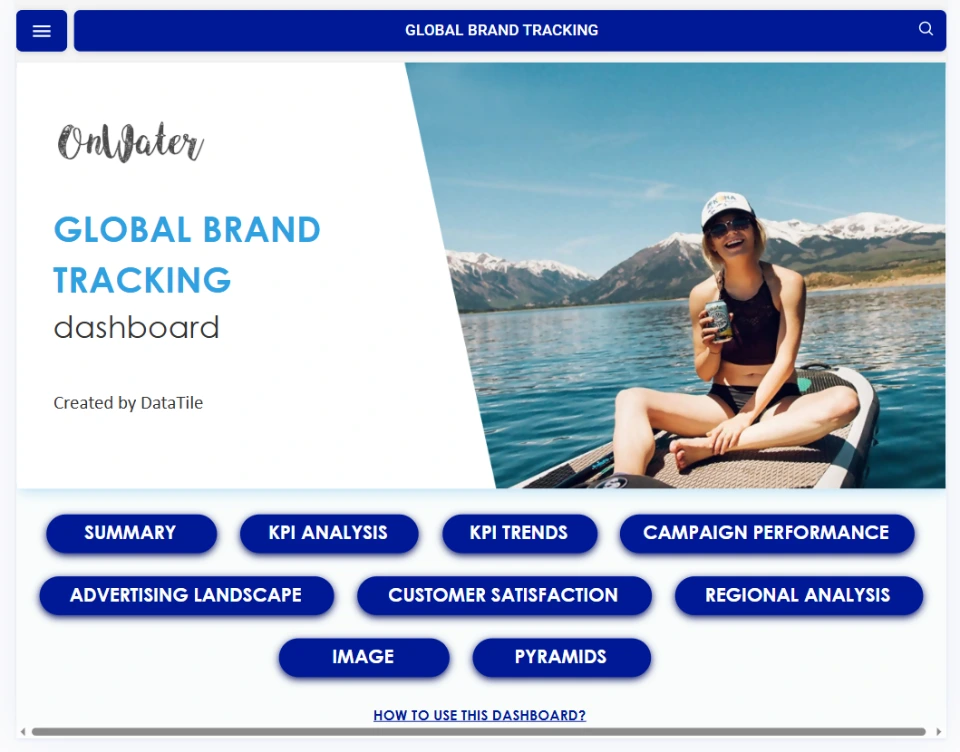
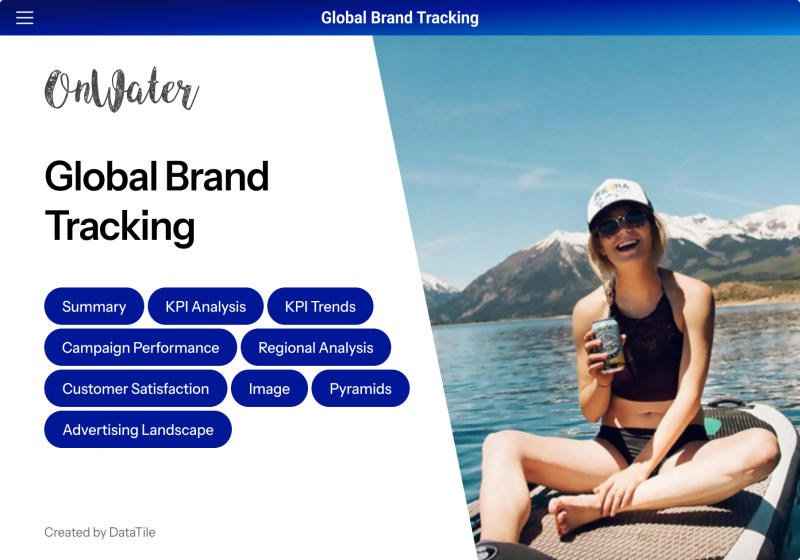
Global Brand Health Tracking Dashboard
Click on the image to open the page with the dashboard
How to make the dashboard easier to use
Use plain-language labels
Use labels that explain what the measure means.
Keep definitions close to the data
Stakeholders should not have to search through a separate methodology document to find out what “consideration” or “current user” means.
Definitions can appear in tooltips, notes or an accessible methodology section.
Make the next step obvious
If awareness has fallen, the user should be able to move easily to the trend, audience and competitor views.
A dashboard should support a line of investigation rather than present a set of disconnected pages.
Provide sensible defaults
Open the dashboard on:
the latest wave;
the main market;
the total audience;
the primary competitor set.
Let users change the view, but do not make them configure it before they see anything useful.
Test it with people who did not build it
Ask a few intended users to open the dashboard and answer basic questions:
How is the brand performing?
What changed in the latest wave?
Which audience moved most?
How does the brand compare with its main competitor?
Where would you look for more detail?
If they cannot answer without help, the dashboard needs more work.

Brand health tracking dashboard checklist
Before publishing a dashboard, check whether it does the following.
Showing too many KPIs at once
Is the intended audience clear?
Are the business questions defined?
Does each page have a clear purpose?
Metrics
Are headline KPIs separated from diagnostic metrics?
Are metric definitions available?
Is the brand funnel structured logically?
Comparisons
Can users compare relevant waves?
Can they compare priority audiences or markets?
Is competitor context available?
Are sample sizes and methodological caveats accessible?
Design
Is there a clear visual hierarchy?
Are the most important changes easy to find?
Are charts selected for the question they need to answer?
Is the opening screen understandable within a few minutes?
Usability
Are default filters sensible?
Are labels written in plain English?
Can users move from a headline result to supporting detail?
Has the dashboard been tested with real stakeholders?
Maintenance
Can the next wave be added without rebuilding the entire report?
Are variables and labels consistent?
Is ownership of future updates clear?
Is there a process for questionnaire changes?
Frequently asked questions
Here are some common questions about our company.
An always-on tracker may be refreshed frequently, while quarterly or annual studies will follow their fieldwork schedule. The dashboard should not update more often than the underlying data can support.
A dashboard is useful for ongoing exploration, recurring tracking and self-service access. PowerPoint is often better for presenting a selected story, recommendation or executive narrative.
Many teams benefit from using both: a dashboard for access to the data and a presentation for communicating the main findings.
Typical users include:
brand teams;
marketing teams;
insight and research teams;
senior management;
regional or local market teams;
research agencies;
strategy and planning teams.
Different users may need different levels of detail, which is why a clear dashboard hierarchy matters.